What Is a Short Strangle?
Short strangle options strategy explained visually: payoff diagrams, Greeks tables, and examples showing how the strategy works.
What Is a Short Strangle?
A short strangle combines selling an out-of-the-money (OTM) call and an OTM put at different strike prices. Both options share the same expiration date. You receive a credit equal to the call premium plus the put premium. Selling strangles is a market-neutral strategy that profits when the stock price stays within the strike prices.
Short Strangle Example
If a stock is at $100, a short strangle would be:
- Sell one 120 call for $2.50
- Sell one 80 put for $2.50
- Total Credit: $5.00
The strangle makes money as long as the stock stays between $75 and $125 as time passes. As the options decay, the strangle price falls, letting you buy it back cheaper. Maximum profit occurs if the stock closes anywhere between $80 and $120 at expiration, and both options expire worthless.
Payoff Diagram
The short strangle payoff is flat between the strikes and slopes downward beyond them:
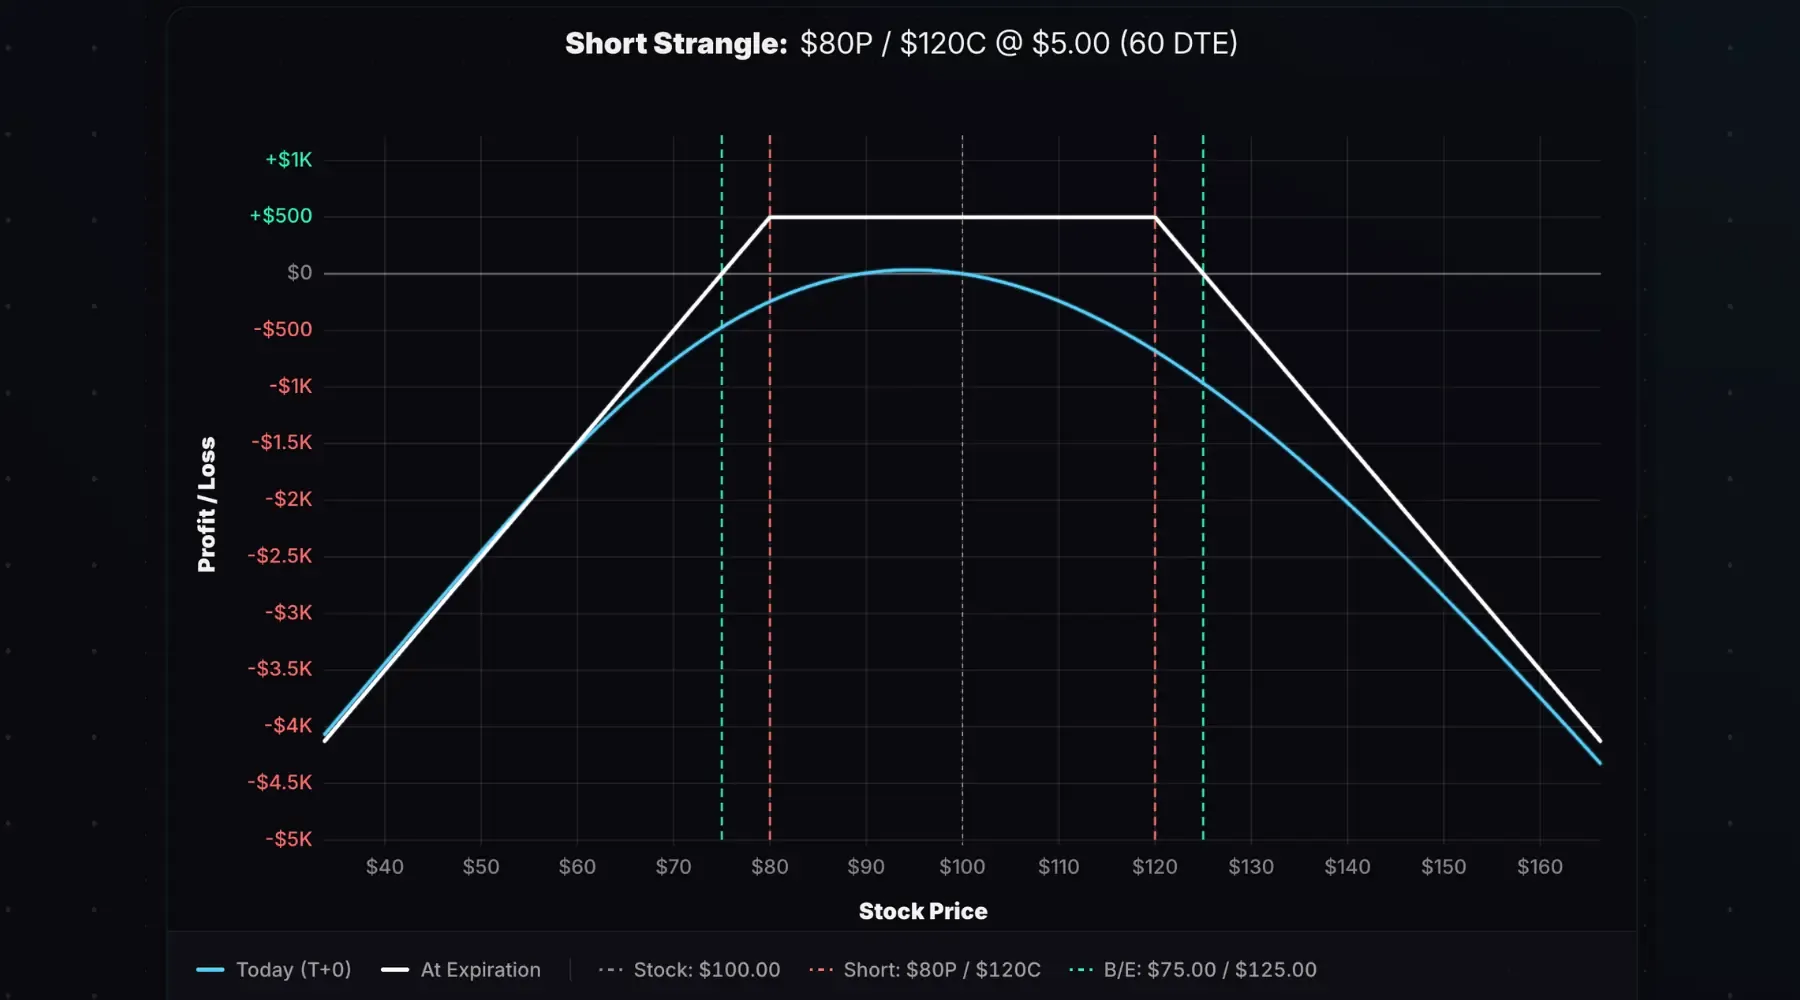
Stock at Entry: $100. Trade: Short 80/120 strangle entered for a $5.00 credit. 60 days to expiration (DTE).
The white line shows the payoff at expiration. The maximum profit of $500 occurs if the stock closes anywhere between $80 and $120 at expiration. Losses grow as the stock moves beyond either short strike, with unlimited risk to the upside.
The cyan line (T+0) shows the modeled payoff at entry.
The gap between the two represents time decay yet to be captured.
Key Characteristics
- Max Profit: Total credit × 100. Occurs if the stock closes between the short strikes at expiration.
- Max Loss: Unlimited to the upside. To the downside, the max loss is capped at (put strike − total credit) × 100 (stock falls to zero).
- Upper Breakeven: Call strike + total credit
- Lower Breakeven: Put strike − total credit
- Outlook: Neutral: expecting the stock to stay within a range
Here are the metrics for an 80/120 strangle sold for $5.00 credit:
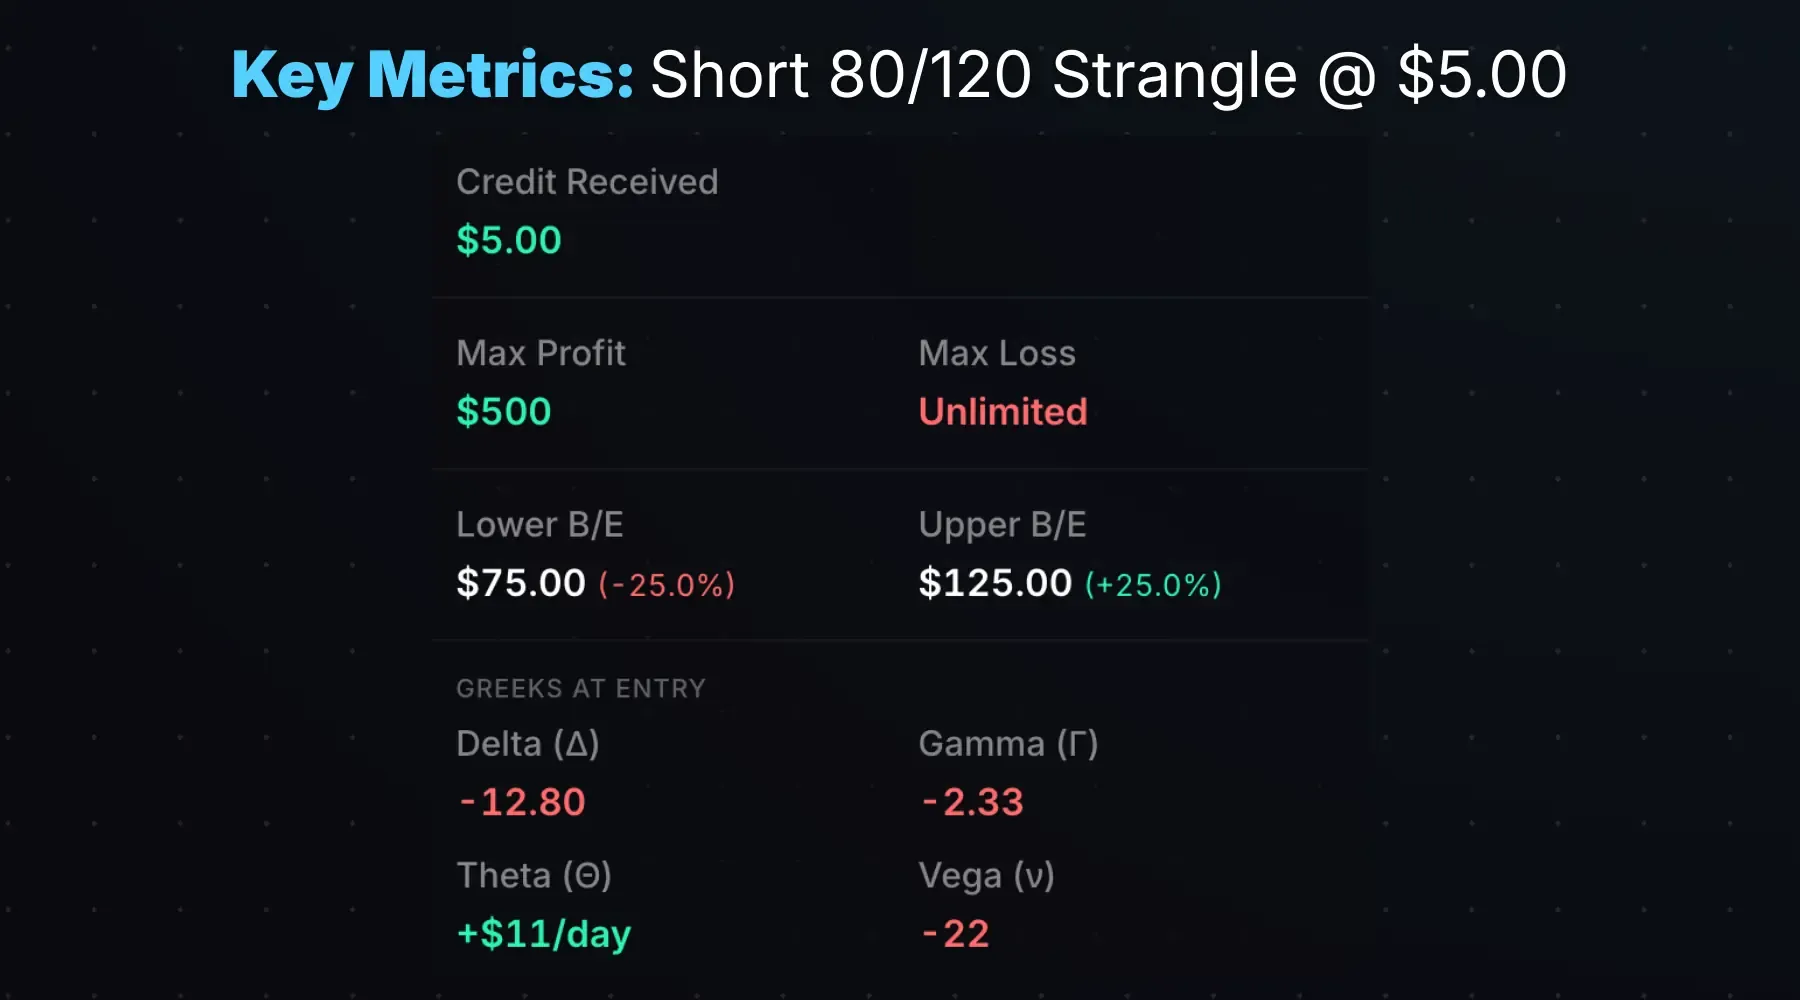
Unlike a straddle, the stock doesn’t need to pin a specific strike. Any close between $80 and $120 achieves max profit. This wider profit zone is the strangle’s main advantage over a straddle.
The breakevens of +/- 25% for this trade give it an extremely high probability of profit, but at the cost of limited profits and undefined risk. Undefined risk also means significant margin requirements, often much larger than the credit received.
How the Greeks Affect a Short Strangle
A short strangle has negative gamma, negative vega, and positive theta. Delta begins near zero, making the trade market-neutral at entry.
| Greek | Exposure | What It Means |
|---|---|---|
| Delta (Δ) | Near Zero | Neutral at entry; shifts as the stock moves |
| Gamma (Γ) | Negative | Delta shifts against you as the stock moves |
| Theta (Θ) | Positive | Time decay benefits the position |
| Vega (ν) | Negative | Rising IV hurts; falling IV helps |
Here’s a 375/525 short strangle on TSLA entered for a $16.00 credit with 53 DTE. The margin requirement to open this trade was $11,300, roughly 7x the credit received. If the stock moves toward either strike, margin can increase further.
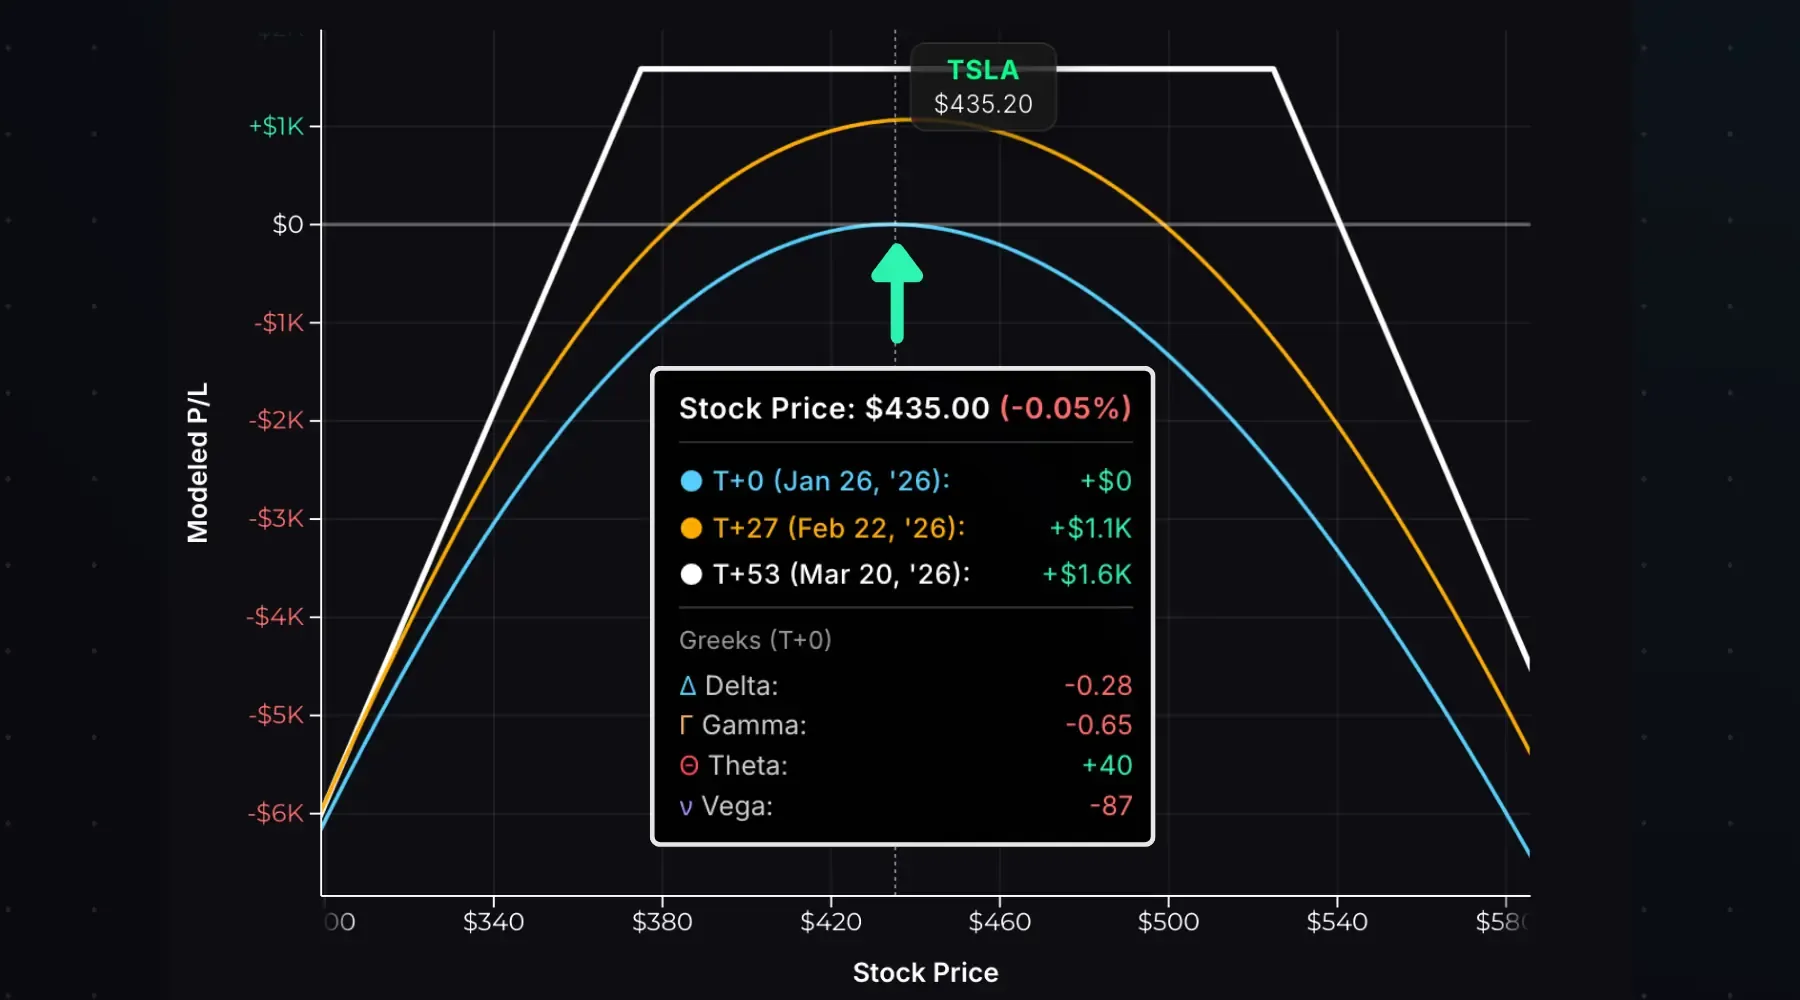
At entry, delta is -0.28, near-neutral. Theta is +40, meaning the position earns roughly $40 per day from time decay with the stock between the strikes.
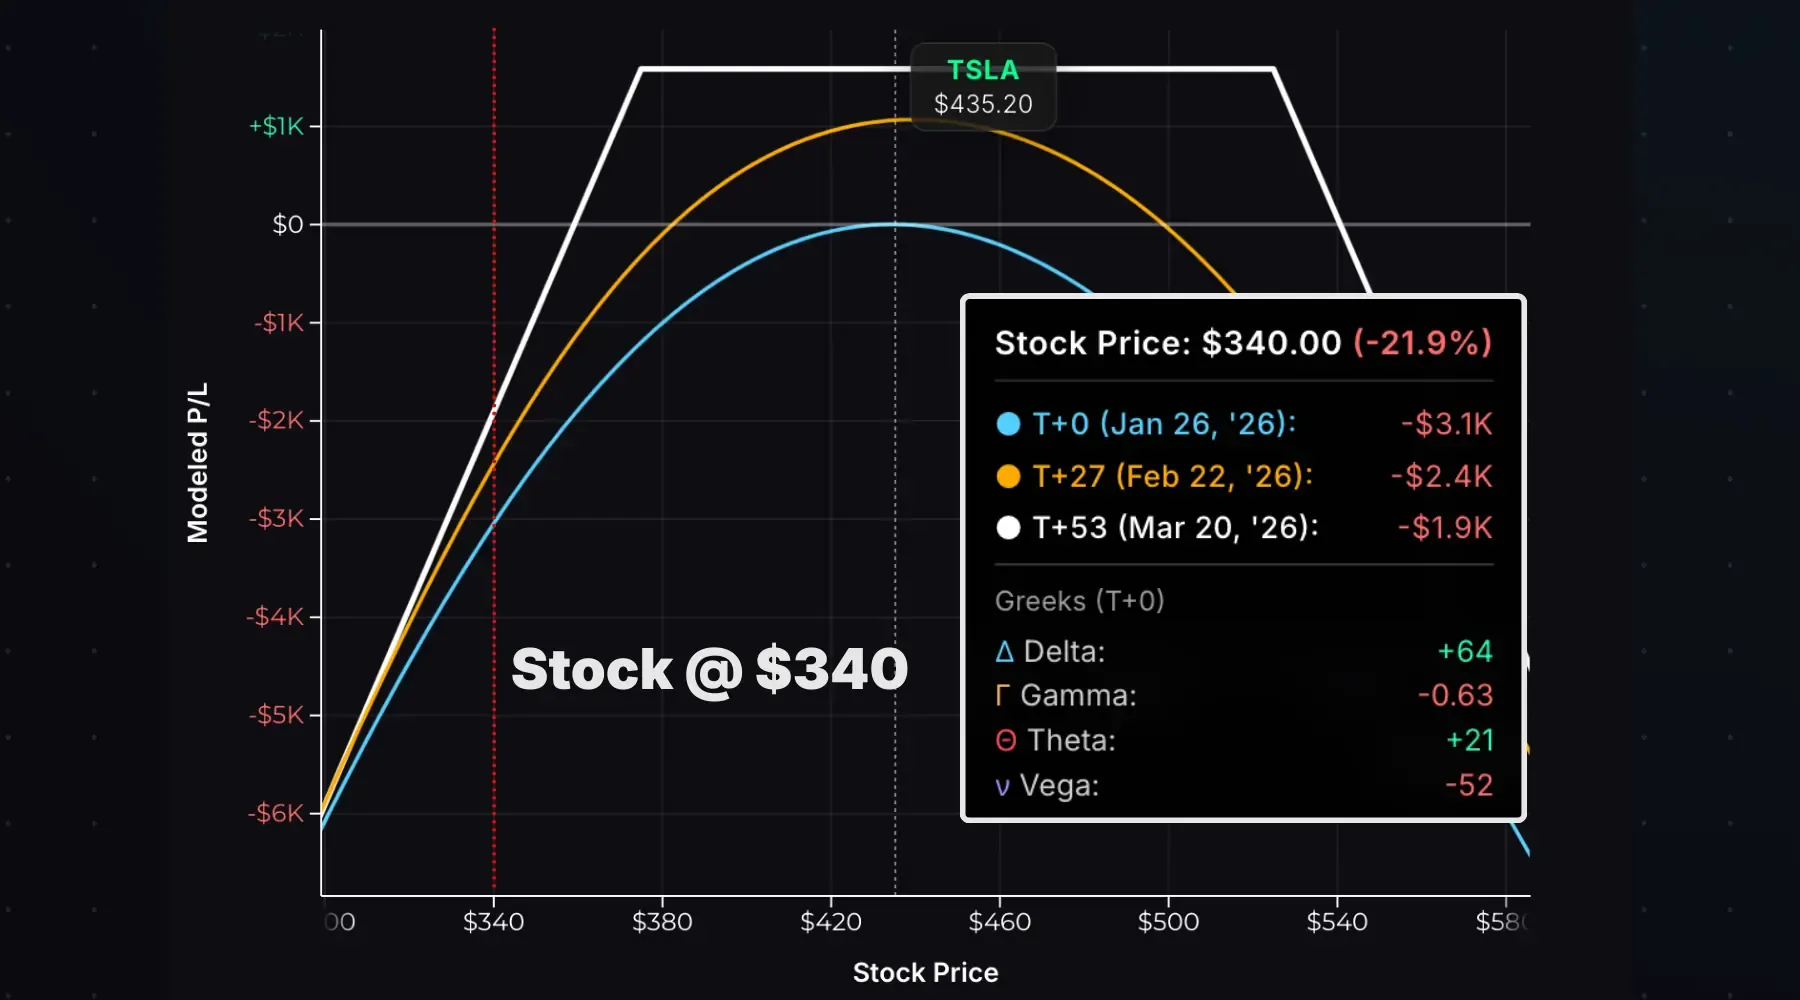
But if the stock moves toward either strike, delta shifts against you. Consider an immediate drop to $340:
Now consider a rally to $550:
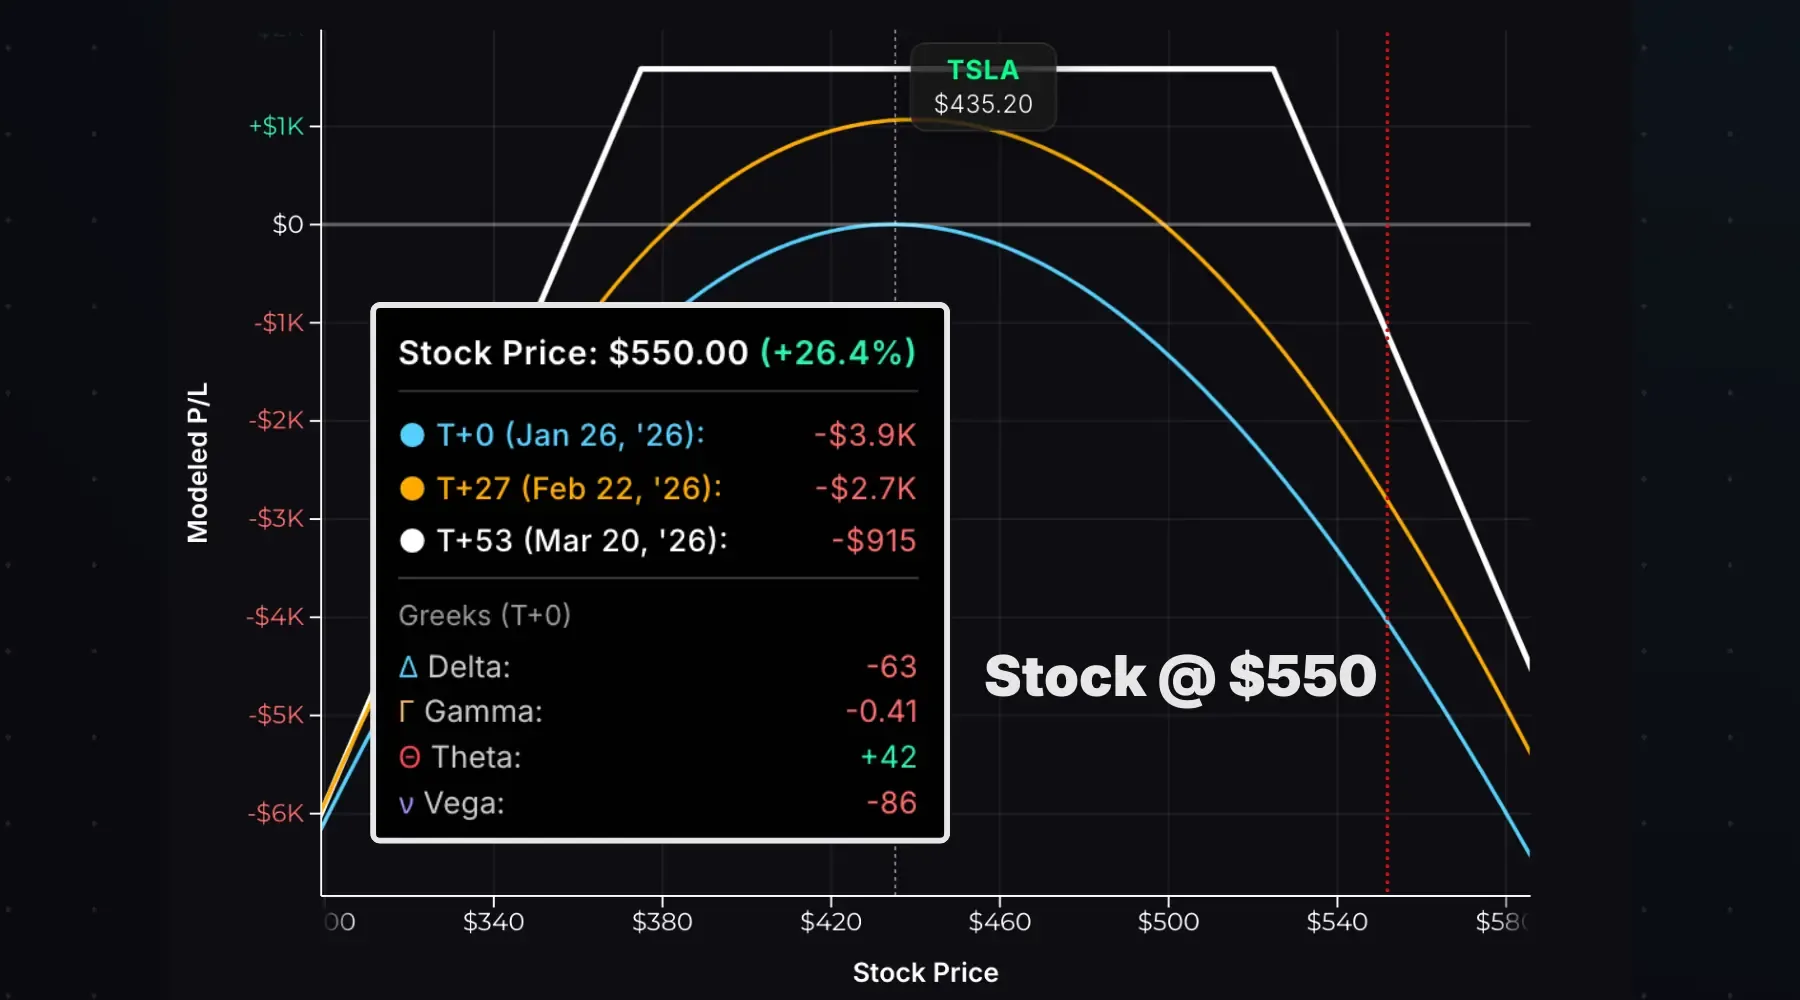
If the stock moves sharply in either direction, delta shifts against you. A drop to $340 pushes delta to +64; a rally to $550 pushes it to -63. In both cases, losses accelerate as the stock continues moving, until delta maxes out at +100 or -100 and the strangle behaves like a long or short stock position.
This is negative gamma in action: delta shifts against you when the stock moves big in either direction.
Time Decay Impact
Time decay is the primary profit engine for a short strangle. As expiration approaches, if the stock stays between the short strikes, the strangle’s value drops, allowing you to buy it back cheaper.
The chart below visualizes time decay. The T+0 curve shows P/L at entry. The T+27, T+45, and T+53 curves show modeled P/L at future dates:
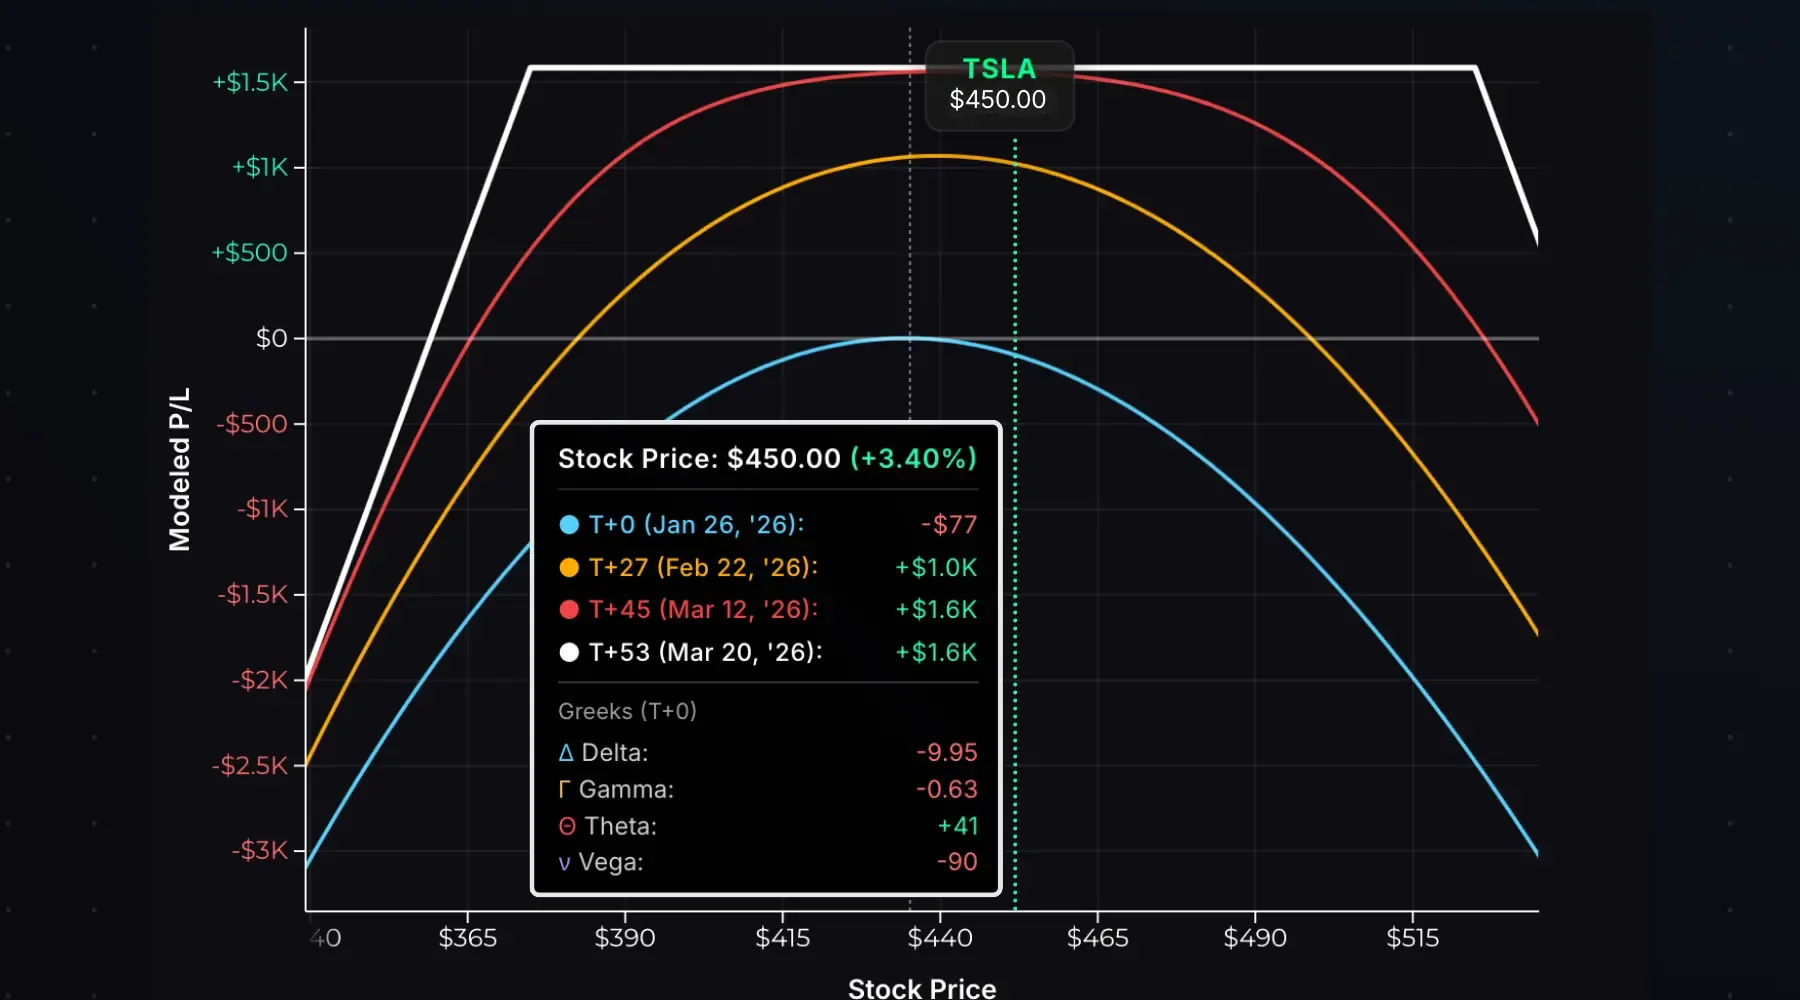
With TSLA at $450 (between the short strikes), here’s how profits evolve:
| Time | P/L |
|---|---|
| T+0 (Entry) | $0 |
| T+27 | +$1,000 |
| T+45 | +$1,600 |
| T+53 (Expiration) | +$1,600 |
Notice that P/L flattens between T+45 and T+53. Once the options are nearly worthless, there’s little extrinsic value left to decay. Unlike a short straddle, a short strangle will achieve max profit much earlier than expiration if the stock is near the midpoint of the short strikes.
OTM Theta Decay Curve
OTM options decay differently than ATM options. The chart below shows a 45-day 110 call on a $100 stock with 30% IV, assuming the stock stays pinned at $100 as expiration approaches:
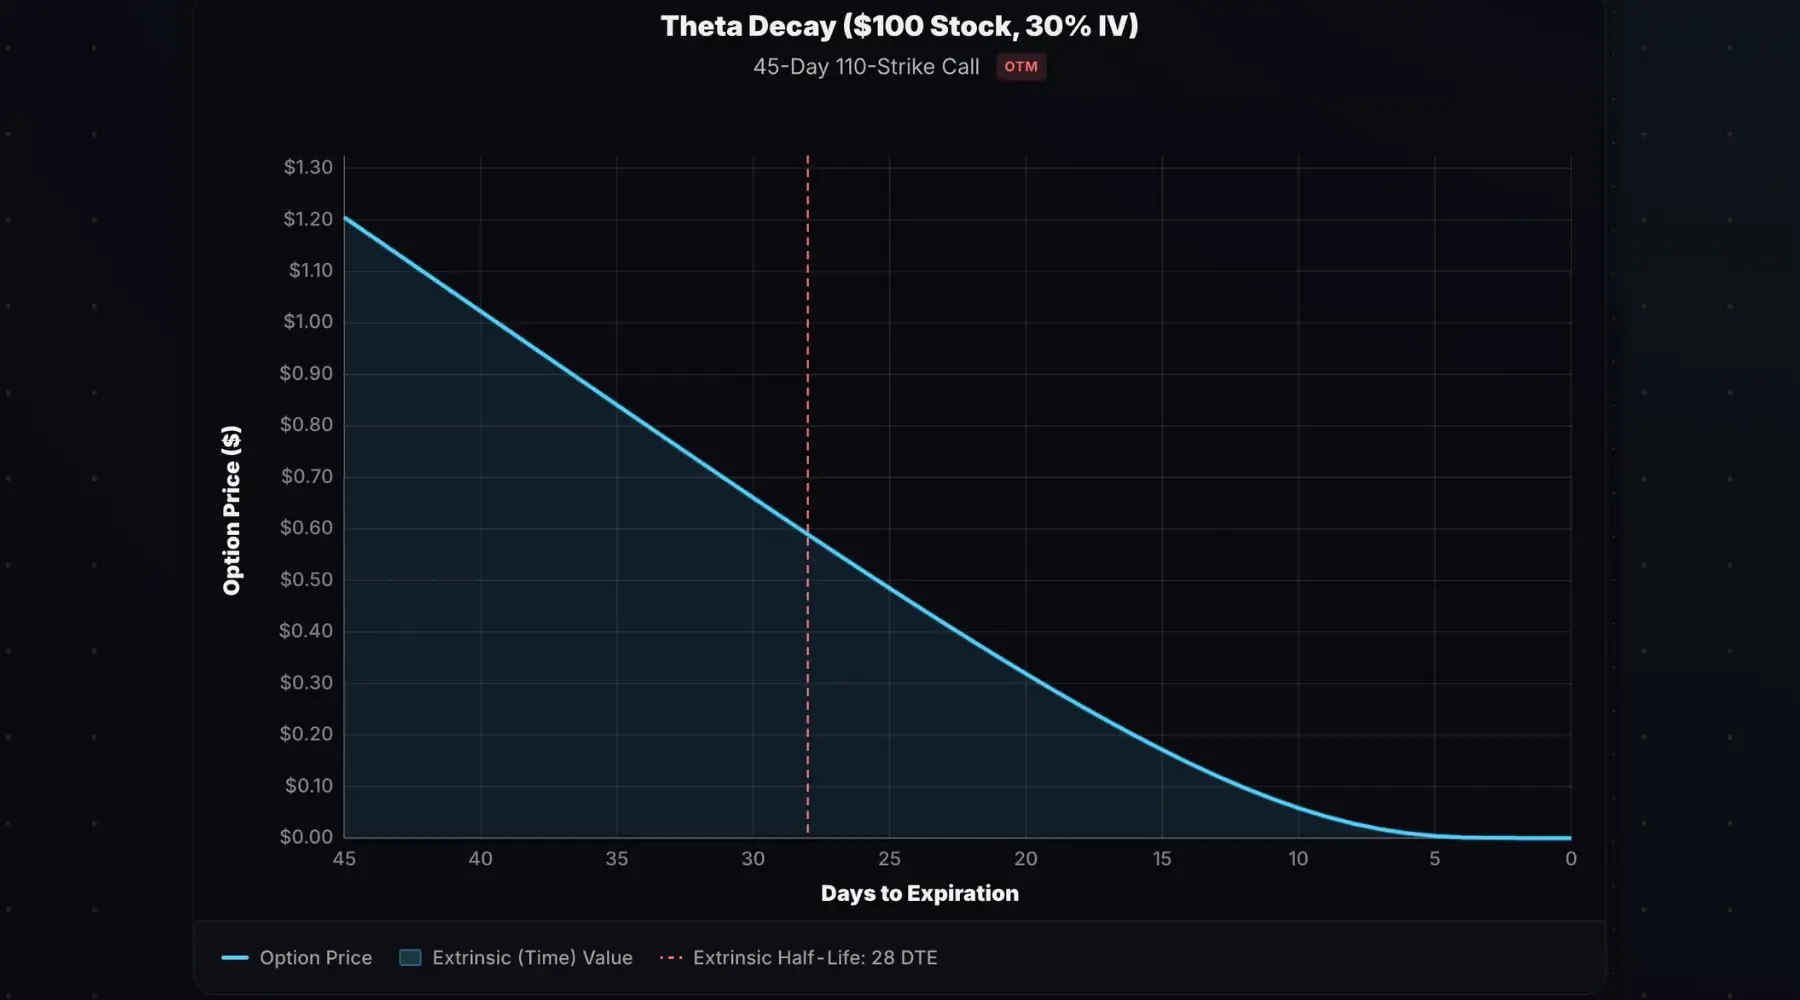
The option loses half its value by 28 DTE and is near zero by 5 DTE. OTM options have more front-loaded decay: they lose value earlier in the trade compared to ATM options.
This benefits short strangles. You reach 50% of max profit sooner than a short straddle, but remember, that 50% is on a smaller dollar amount since strangles collect less premium.
Model decay curves like this one with our theta decay curve calculator.
Implied Volatility Impact
Short strangles are short volatility trades. The position has negative vega: it benefits when implied volatility falls and suffers when IV rises.
The chart below shows the modeled impact of an immediate 10% IV increase on this TSLA strangle:
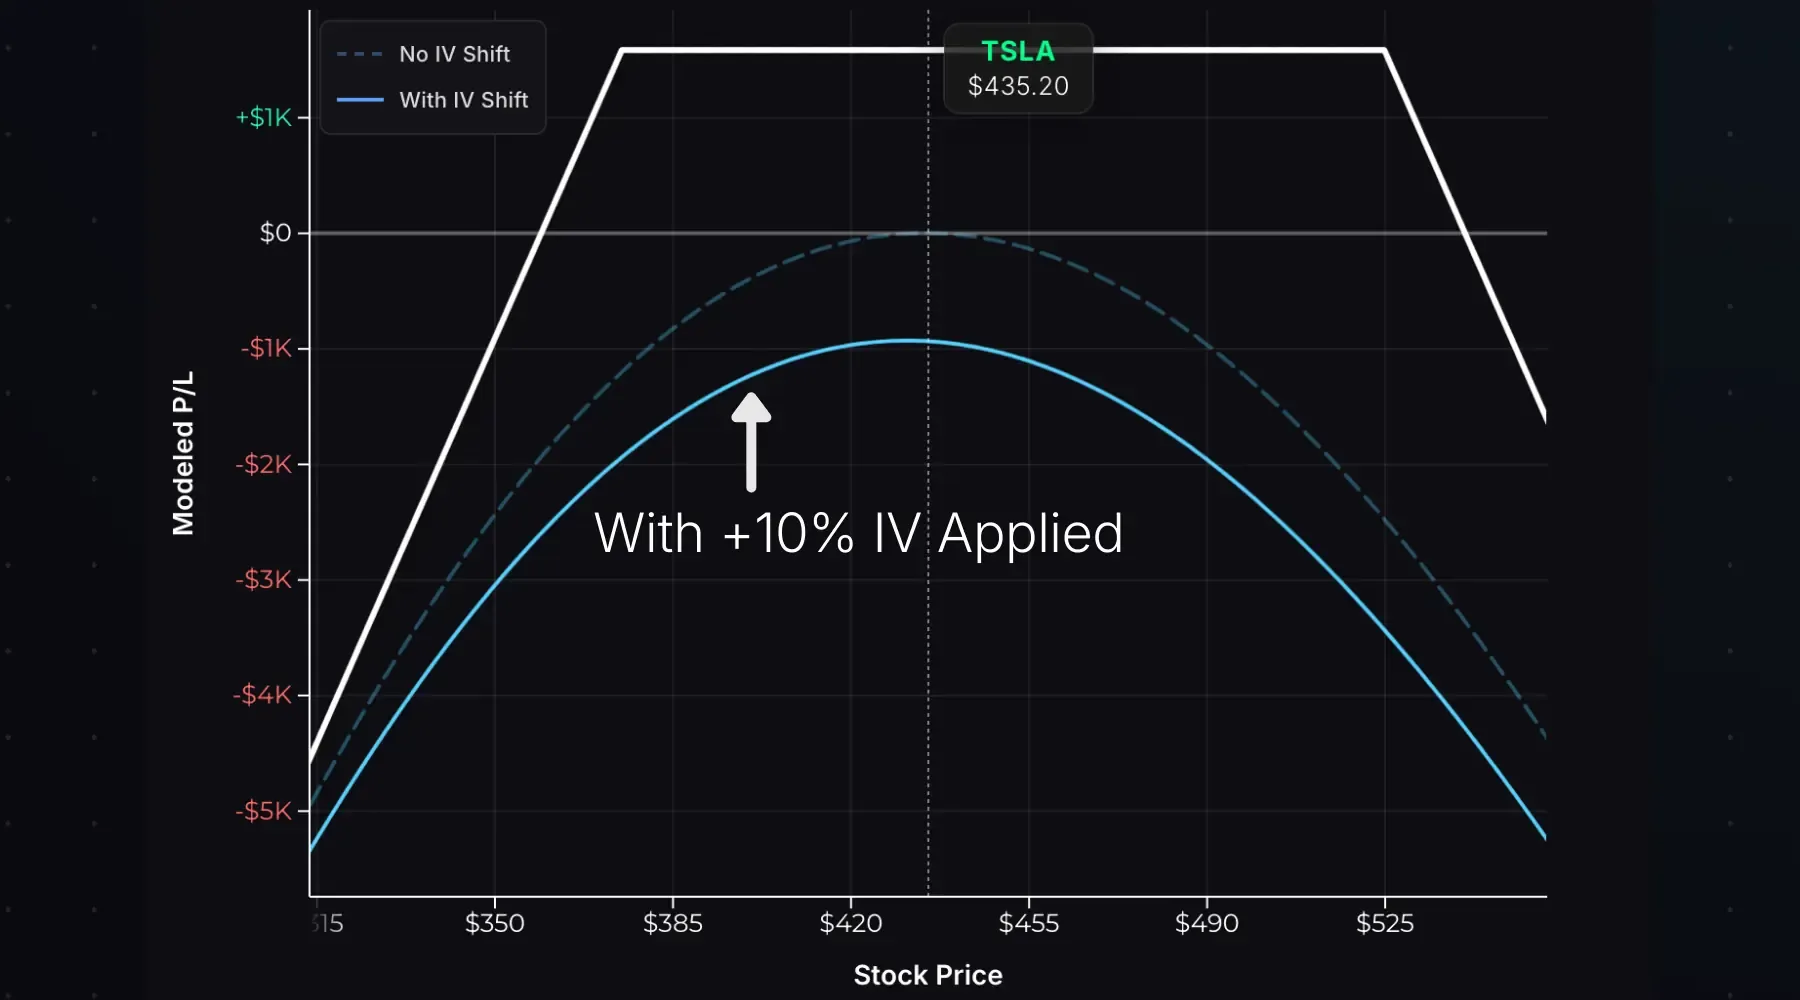
The dashed line is the original T+0 P/L curve at entry. The solid line shows projected P/L with +10% IV applied. All values on the shifted curve are negative. The IV spike alone puts the position underwater, even with the stock price in the middle of the strikes.
How to interpret this: selling a strangle is a bet that a stock’s actual movements will be smaller than implied. If the market prices in a larger expected move after you sell a strangle, the option prices rise and you’re underwater.
Try calculating option prices at different IV levels with our Options Pricing Calculator.
Strike Selection
Strike selection determines your risk/reward tradeoff. Many traders choose strikes based on delta, which approximates the probability of that option expiring ITM.
The 16-Delta Rule
Delta is expressed as a decimal (0.16), but traders often drop the zero and say “16 delta.” Selling 16-delta options on each side places your strikes near one standard deviation from the current stock price, statistically a 68% chance both options expire worthless.
Delta and Probability of Profit
A quick way to estimate your probability of expiring ITM: add the absolute deltas of both short strikes.
| Strike Deltas | Approx. Probability of Either Expiring ITM |
|---|---|
| 16Δ call + 16Δ put | ~32% |
| 20Δ call + 20Δ put | ~40% |
| 25Δ call + 25Δ put | ~50% |
| 30Δ call + 30Δ put | ~60% |
Lower delta = wider strikes = higher probability of profit, but less premium collected. Higher delta = tighter strikes = more premium, but the stock has less room to move.
Skewing Directionally
You don’t have to sell symmetric strikes. Adjusting the deltas lets you express a directional bias while still collecting premium from both sides.
Example: Sell a 30-delta put and a 15-delta call.
- Net position delta: +15 (slightly bullish)
- You’re giving the stock more room to rally than to fall
- Useful when you’re neutral-to-bullish but still want to sell premium on both sides
The tradeoff: your position is no longer market-neutral at entry. If the stock drops, you’ll take losses faster than a symmetric strangle.
Entry, Exit, and Expiration
To enter: Sell an OTM call and OTM put at different strikes with the same expiration. You’ll receive a credit.
To exit before expiration: Buy back both options in a single order. You’ll pay a debit to close. Profit = credit received − debit paid.
Potential scenarios at expiration, using an 80/120 strangle sold for $5:
| Stock at Expiration | Result |
|---|---|
| $100 (between strikes) | Both expire worthless. Keep $500 credit. |
| $122 (within breakeven) | Call $2 ITM, assigned -100 shares at $120. Net profit: $300. |
| $60 (beyond breakeven) | Put $20 ITM. Net loss: $1,500. |
Selling Strangles Around Earnings
Some traders sell strangles before earnings announcements to capture the IV crush. This is extremely high-risk.
Earnings reports are catalysts for large moves in either direction. Options in the “earnings expiration cycle” (the nearest expiration after the announcement) trade at elevated IV to reflect this uncertainty.
Traders sometimes fall prey to thinking selling deep OTM options through earnings is an easy way to make money. It’s not. Eventually you will get wiped out when a stock has a blowout quarter, or announces something the market wasn’t pricing in.
Bottom line: Never short naked options through earnings. Define your risk on a short strangle by buying protective wings (selling iron condors instead of strangles).
Early Assignment
Both legs of a short strangle carry early assignment risk, though it’s unlikely unless one leg moves significantly ITM.
Short Call Assignment: You sell (short) 100 shares at the call strike price. Most likely when deep ITM with little extrinsic value, or on the day before ex-dividend if its extrinsic value is less than the dividend.
Short Put Assignment: You buy 100 shares at the put strike price. Most likely when deep ITM with little extrinsic value near expiration.
If one leg is assigned early, you’ll have a stock position plus the remaining short option:
| Assigned Leg | Resulting Position |
|---|---|
| Short Put | Long 100 shares + short call = Covered Call |
| Short Call | Short 100 shares + short put = Covered Put |
Monitor extrinsic value if either option goes ITM. If it approaches zero, assignment risk is elevated. Assignment can also trigger a margin call if your account lacks sufficient equity for the stock position.
Short Strangle vs Long Strangle
A long strangle is the opposite position: buying an OTM call and put instead of selling them.
| Short Strangle | Long Strangle | |
|---|---|---|
| Entry | Credit | Debit |
| Max Profit | Limited (premium received) | Unlimited |
| Max Loss | Unlimited | Limited (premium paid) |
| Profits When | Stock stays between strikes | Stock moves big in either direction |
| Volatility Exposure | Short (benefits from falling IV) | Long (benefits from rising IV) |
| Theta | Positive (time helps) | Negative (time hurts) |
Short Strangle vs Short Straddle
A straddle sells a call and put at the same strike, typically ATM.
| Short Strangle | Short Straddle | |
|---|---|---|
| Strikes | Different (OTM call, OTM put) | Same (ATM) |
| Premium Collected | Lower | Higher |
| Profit Zone | Wider | Narrower |
| Max Profit | Lower | Higher |
| Breakevens | Further from stock price | Closer to stock price |
Example: Stock at $100.
- Short strangle for $5: Sell 120 call, sell 80 put → breakevens at $75 and $125
- Short straddle for $10: Sell 100 call, sell 100 put → breakevens at $90 and $110
The strangle gives more room for the stock to move but collects less premium. OTM options also decay faster on a percentage basis, so a strangle reaches 50% profit sooner, but that 50% is on a smaller credit. Model both with our Strangle Calculator and Straddle Calculator.
Short Strangle vs Short Iron Condor
A short iron condor is a short strangle with protective wings, buying a further OTM call and put to limit risk.
| Short Strangle | Short Iron Condor | |
|---|---|---|
| Risk | Unlimited | Defined |
| Max Profit | Higher | Lower (long options reduce the credit) |
| Max Loss | Unlimited | Limited (wing width − credit) |
| Margin Requirement | High | Lower |
Example: Stock at $100.
- Short strangle for $5: Sell 120 call, sell 80 put
- Short iron condor for $2.50: Sell 120 call, sell 80 put, buy 130 call, buy 70 put
The iron condor sacrifices profit potential for defined risk. If you want strangle-like exposure with limited downside, the iron condor provides that.
- A short strangle sells an OTM call and OTM put at different strikes with the same expiration, collecting a credit.
- Max profit equals the total premium received and occurs anywhere between the short strikes; max loss is unlimited to the upside and substantial on the downside.
- Short strangles are negative gamma, negative vega, and positive theta: they profit from time decay and falling IV.
- Never short naked strangles through earnings. Define your risk with protective long options further OTM.
Related Guides
- What Is a Short Straddle?: Like a strangle, but sell the same strike. Higher premium, narrower profit zone.
- What Is Theta?: Understanding time decay
- What Is Gamma?: Why stock movements hurt short premium trades
- What Is Vega?: How volatility affects option prices
- What Is Implied Volatility?: The key input driving strangle prices
Ready to model your own strangles? Use our Strangle Calculator to visualize P/L for any short strangle position.