Option Modeler: Visualize Your Trades
Build any combination of stocks and options, see your P/L curve with live market data, and model exactly how time, volatility, and adjustments change your risk — so there are no surprises after you place a trade.
Options are multi-dimensional and hard to visualize in your head.
When you're new, it's almost impossible to know how your P/L will look as price, time, and volatility change.
The Option Modeler shows you that entire picture before you trade, so you can learn and make decisions without guessing.
Build any combination of stocks and options: vertical spreads, iron condors, covered calls, or any custom multi-leg position.
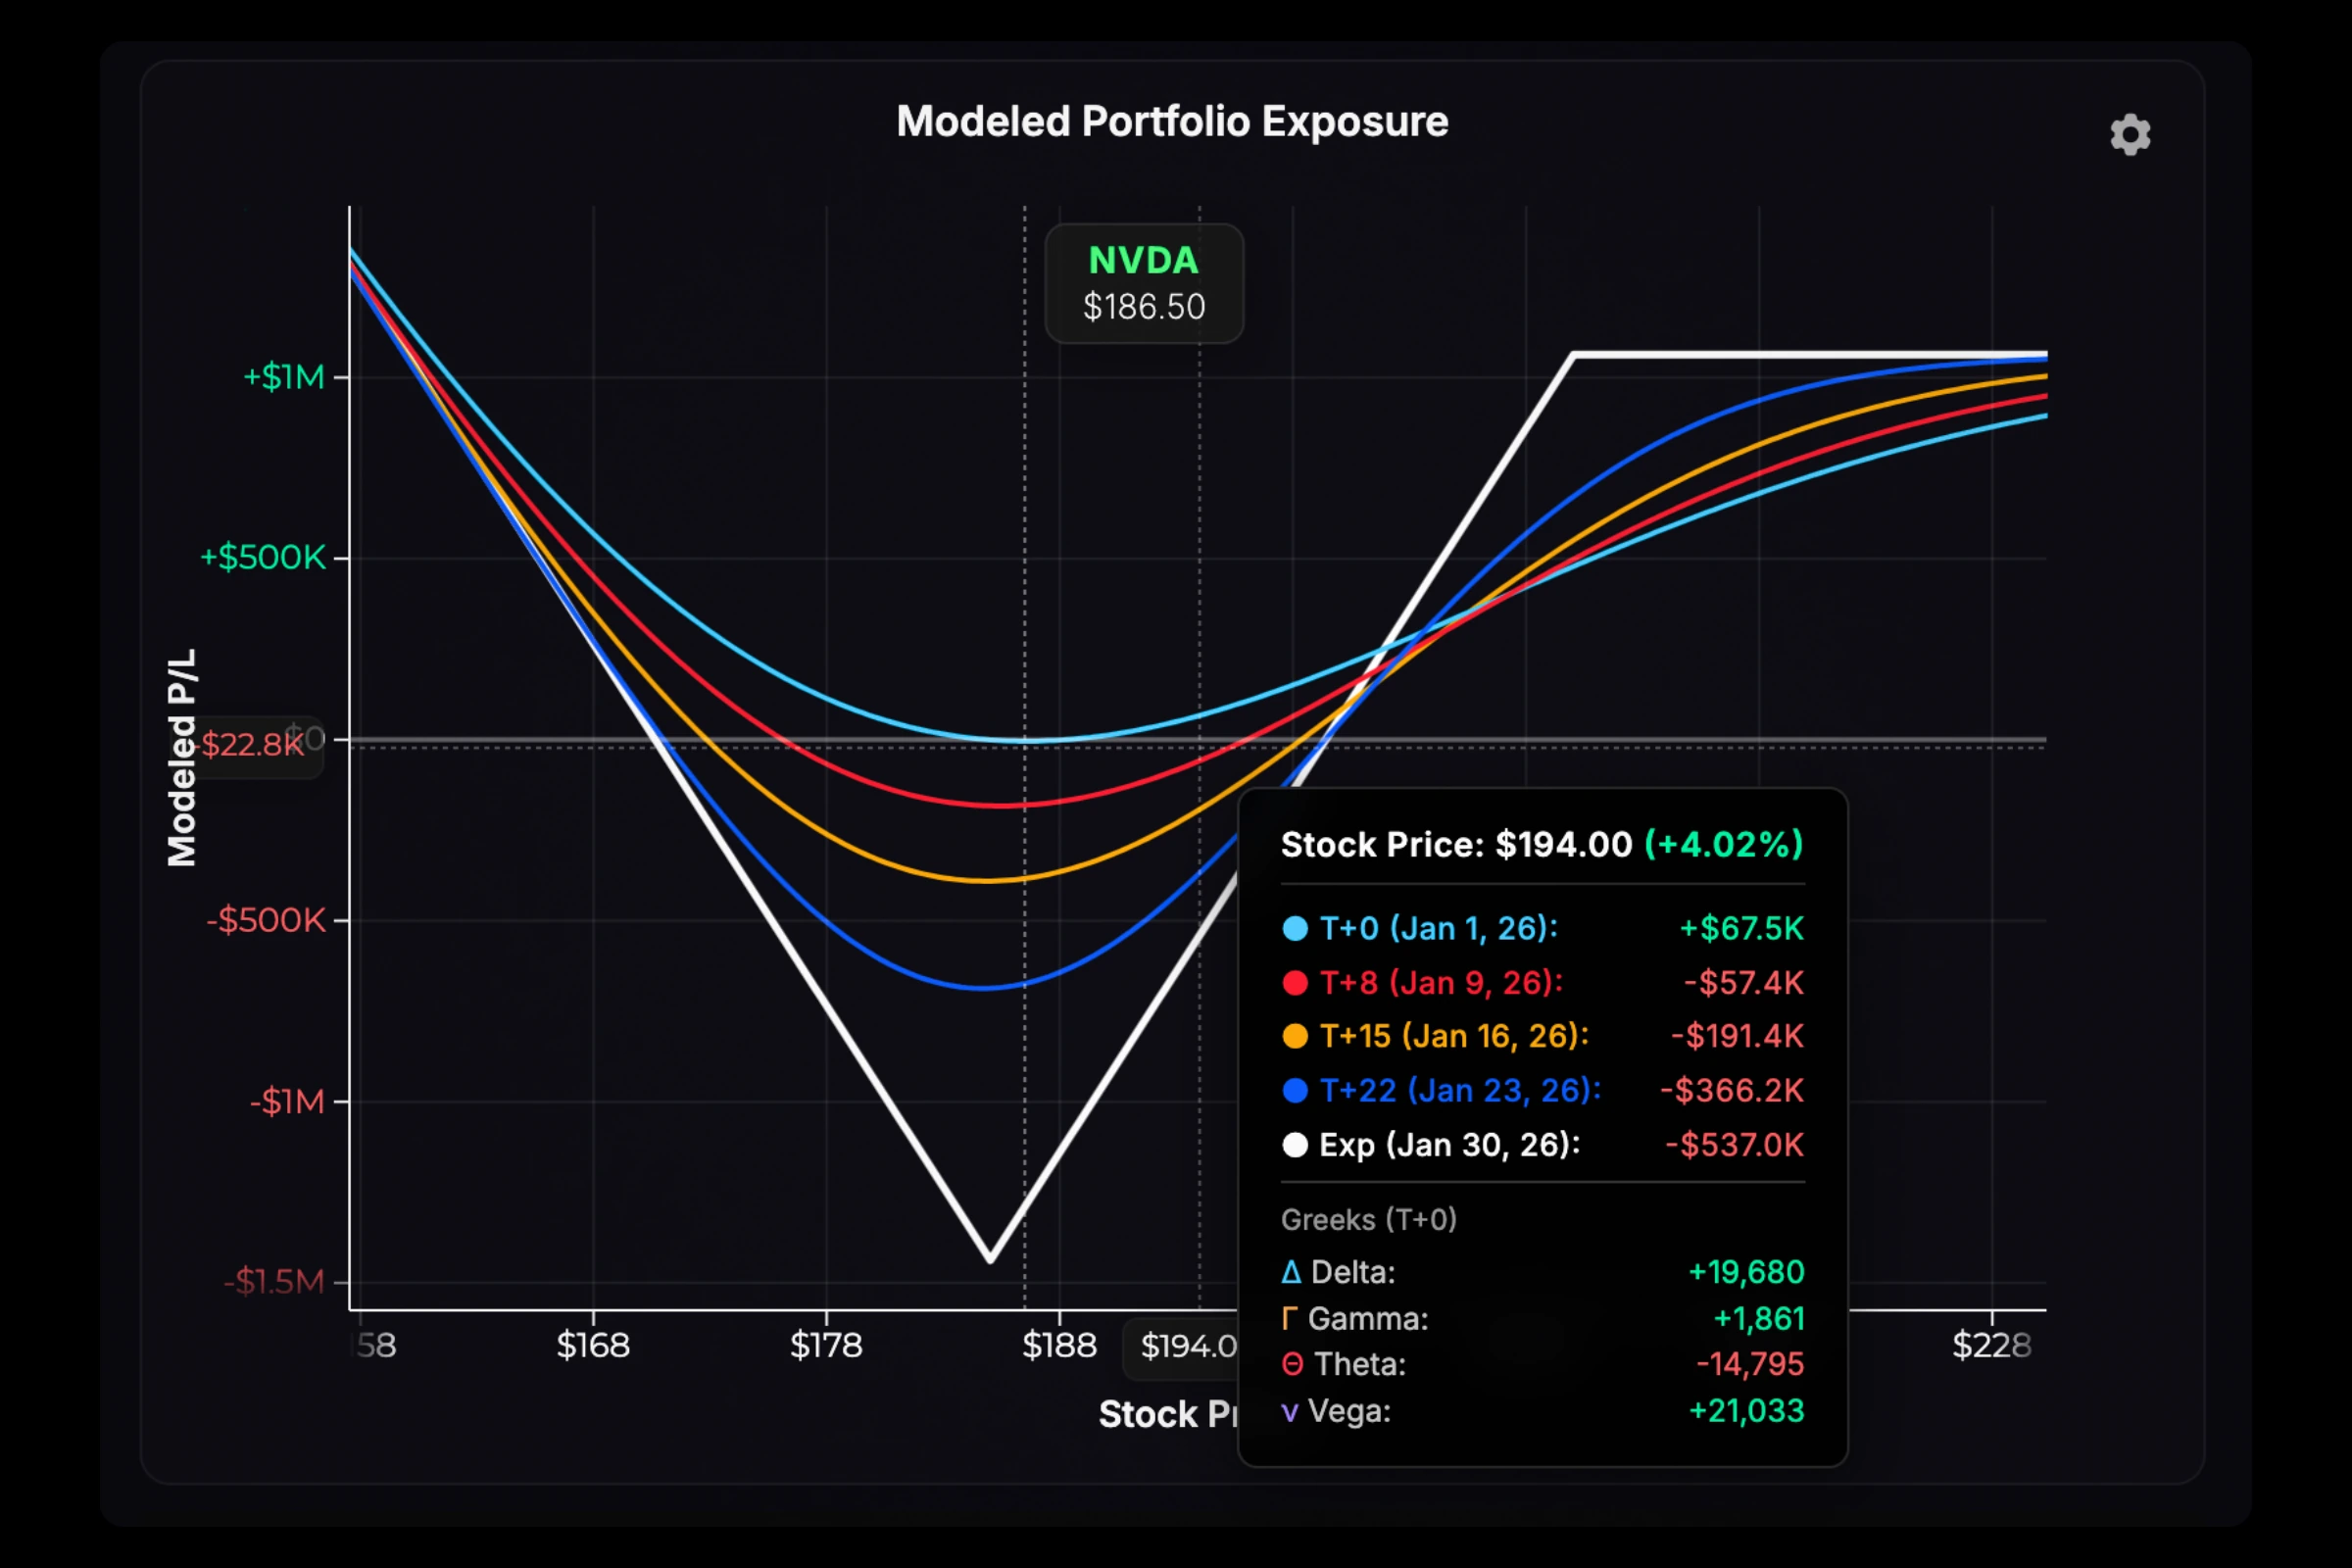
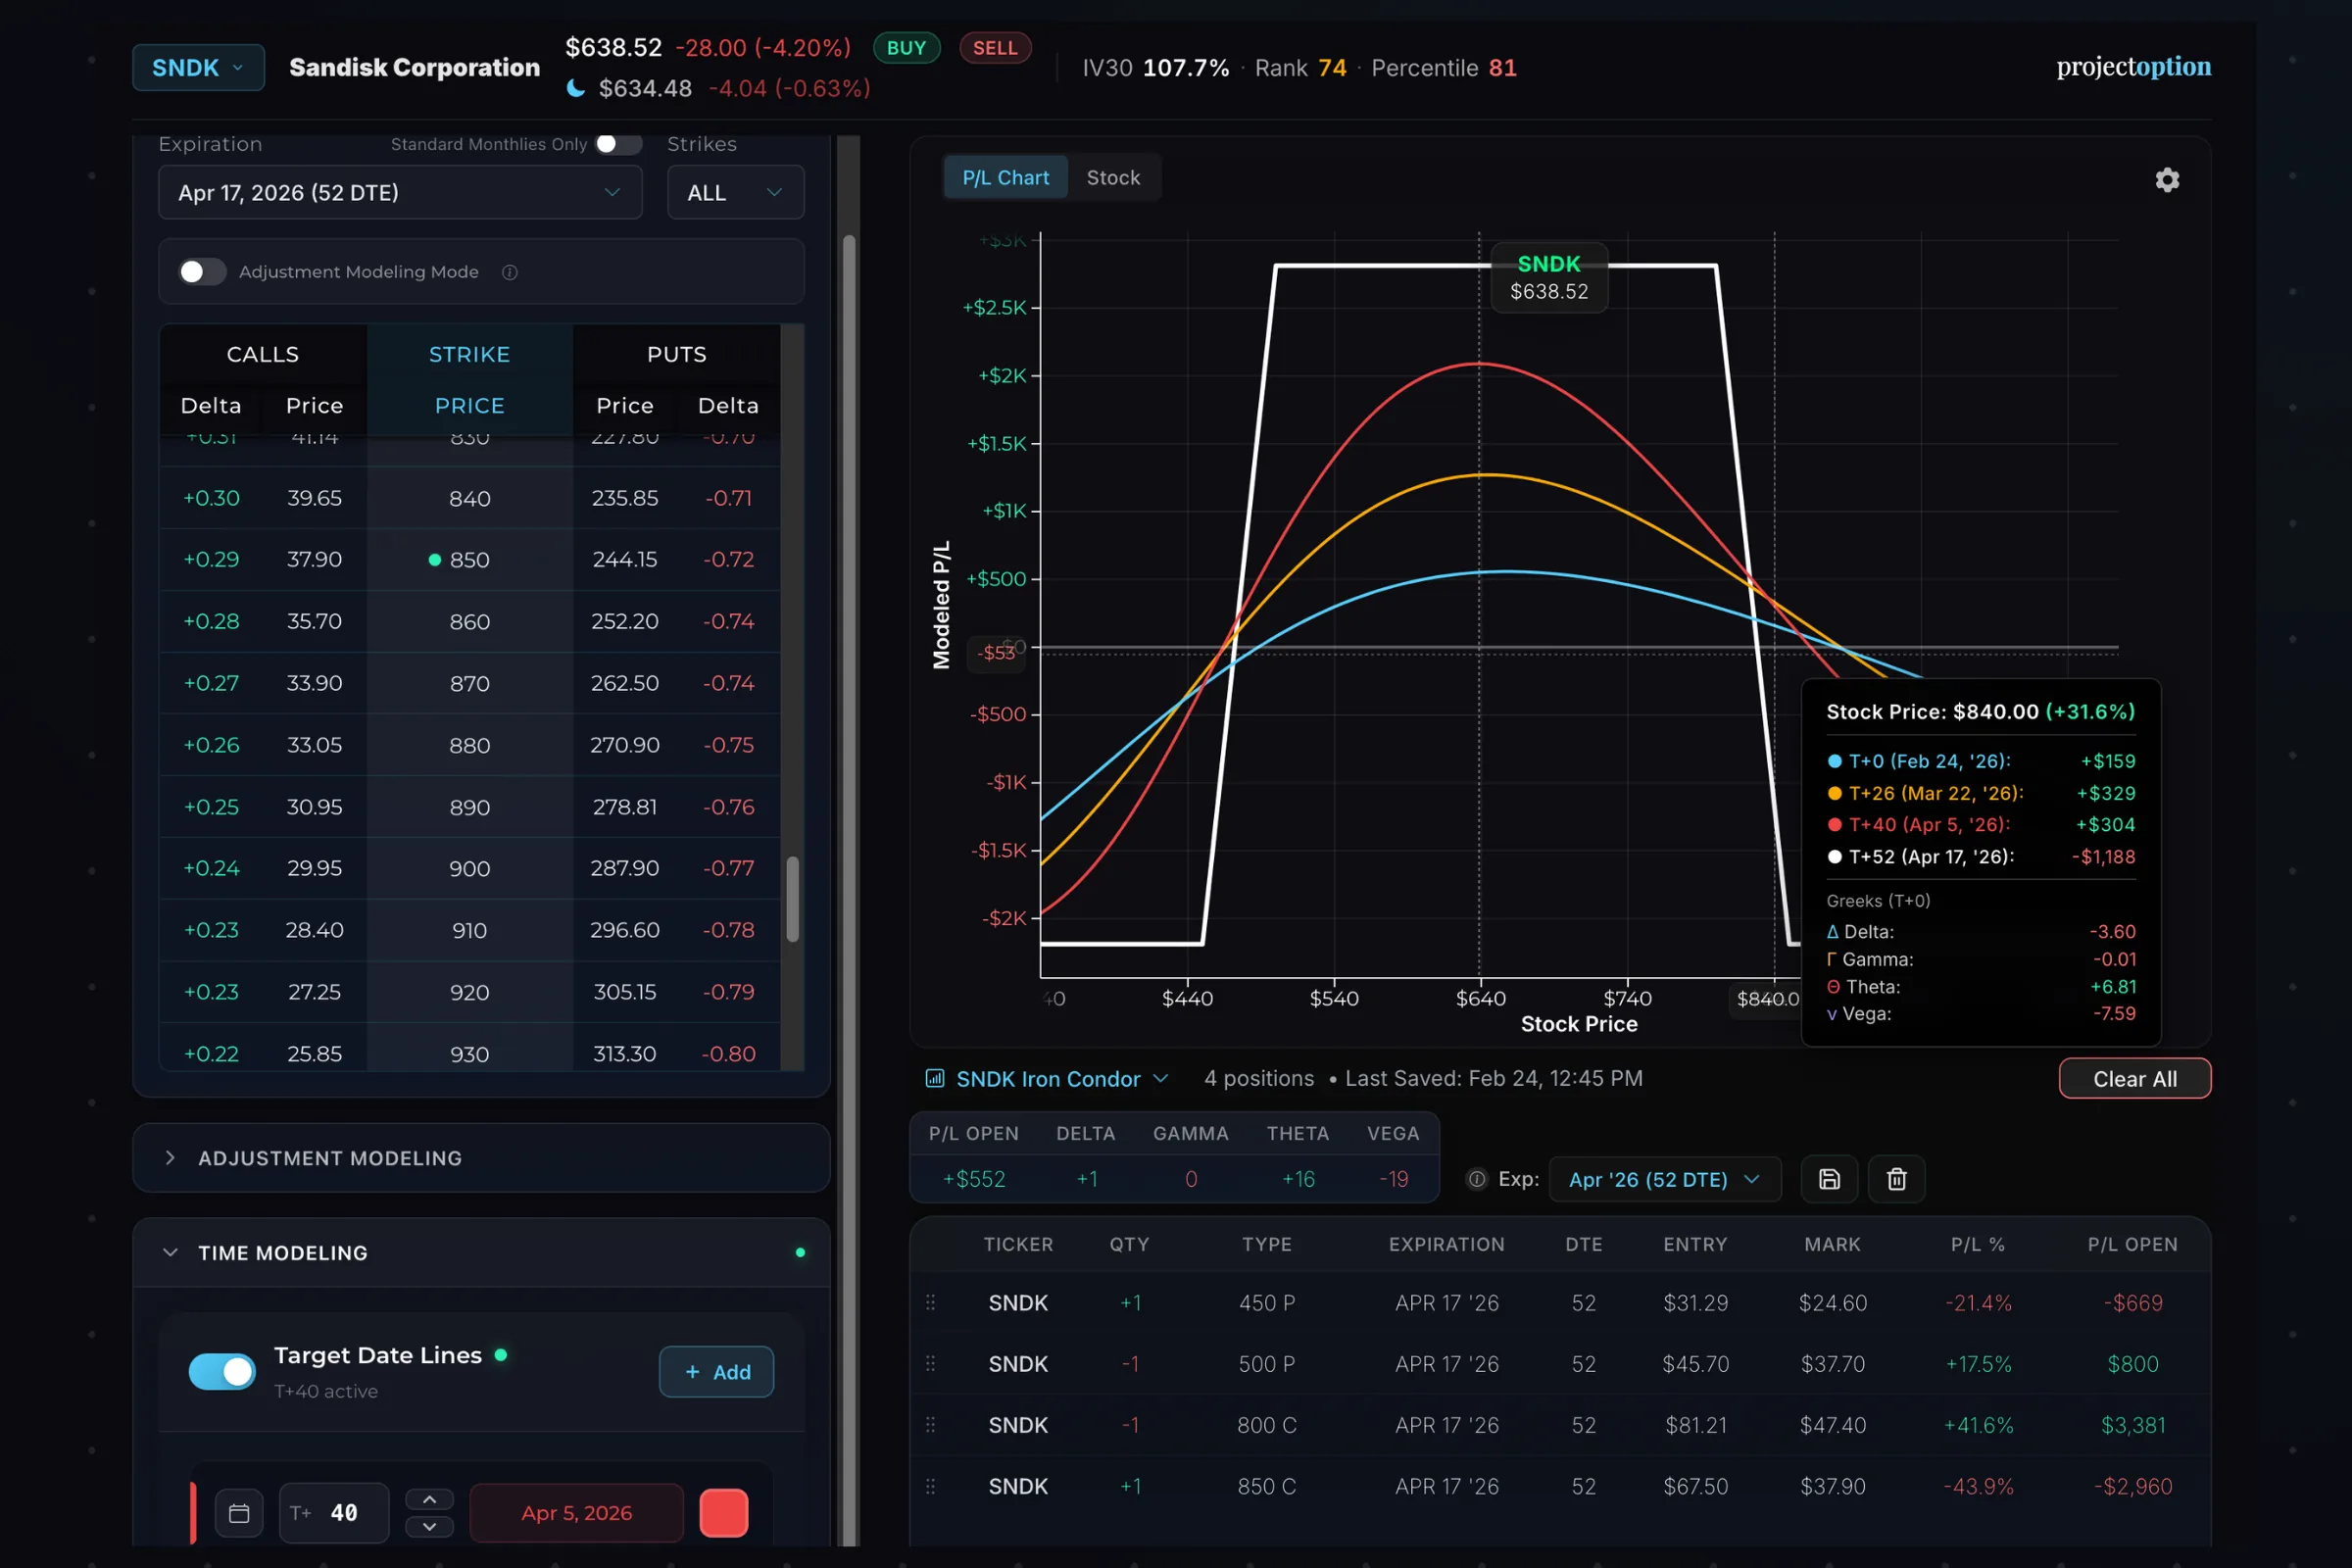
See your P/L curves right now and through expiration. Visualize breakevens, max profit, max loss, and the Greeks, all in one view, updating with live market data.
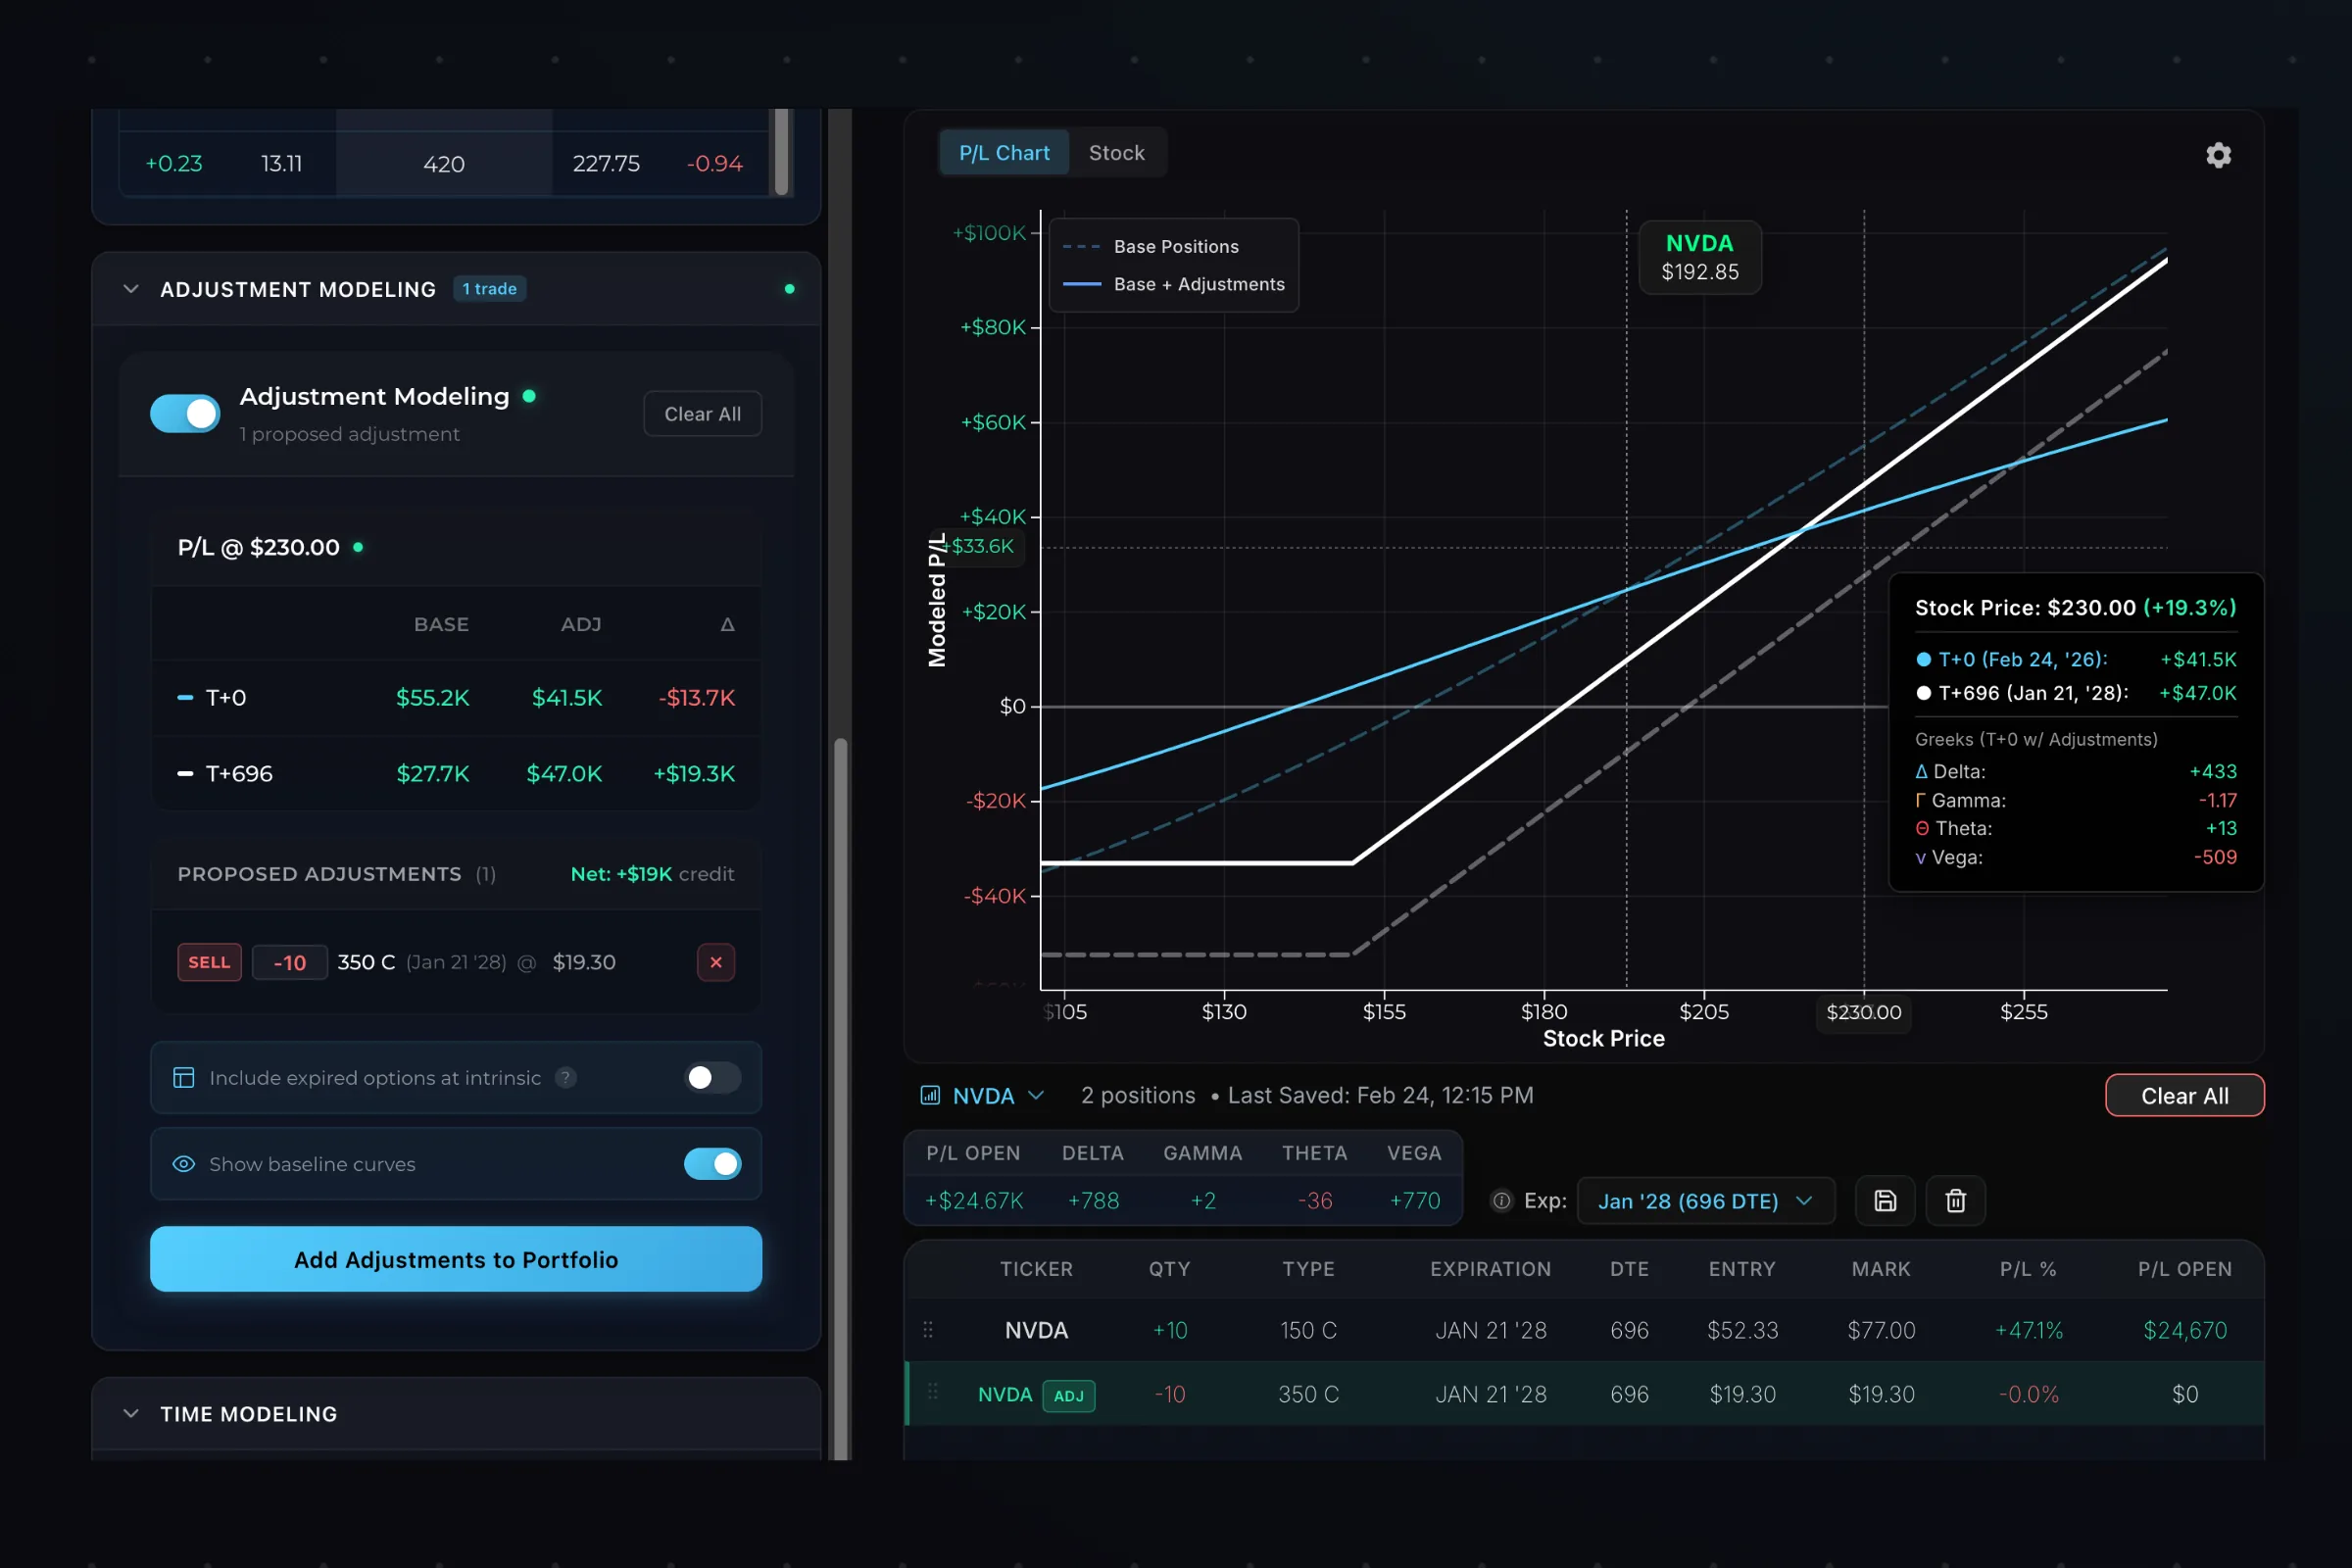
Visualize and quantify trade adjustments.
Add adjustments and instantly compare your current vs. adjusted P/L curves at any stock price and point in time, before committing any orders.
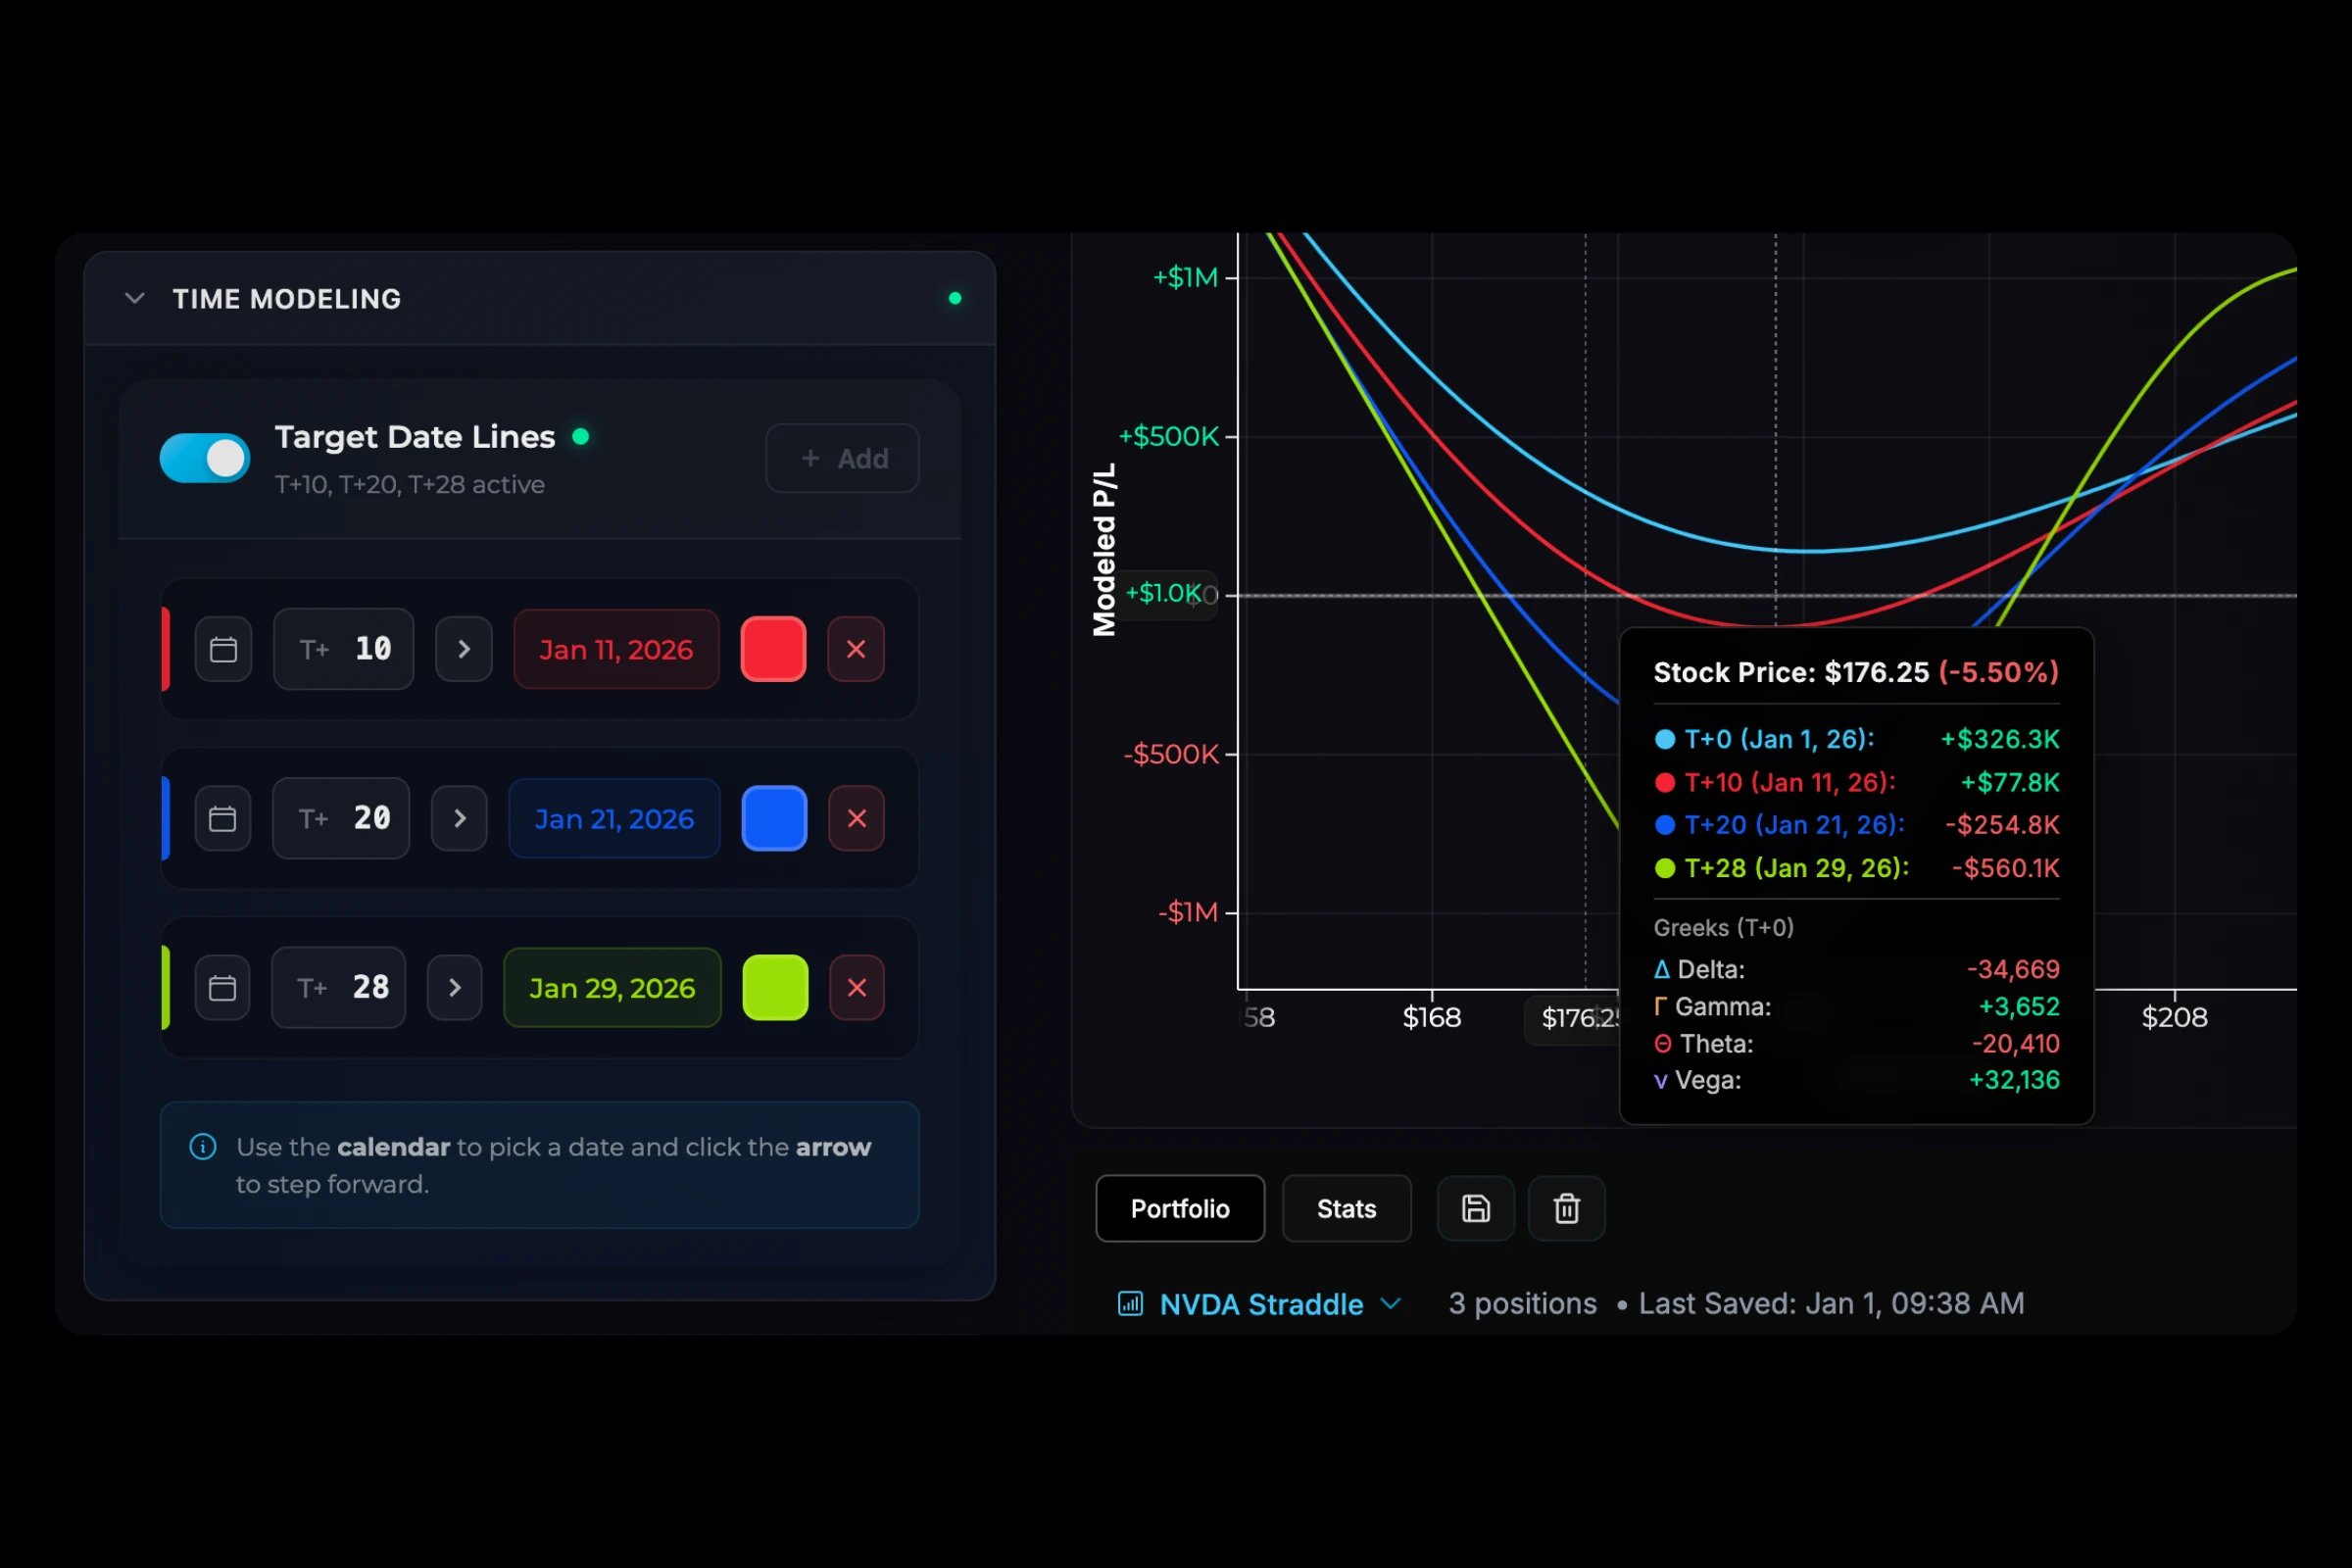
Model the impact of time decay.
T+ time modeling projects your P/L curve to any future date before expiration. See how theta works for or against you in 7 days, 30 days — or any custom date.
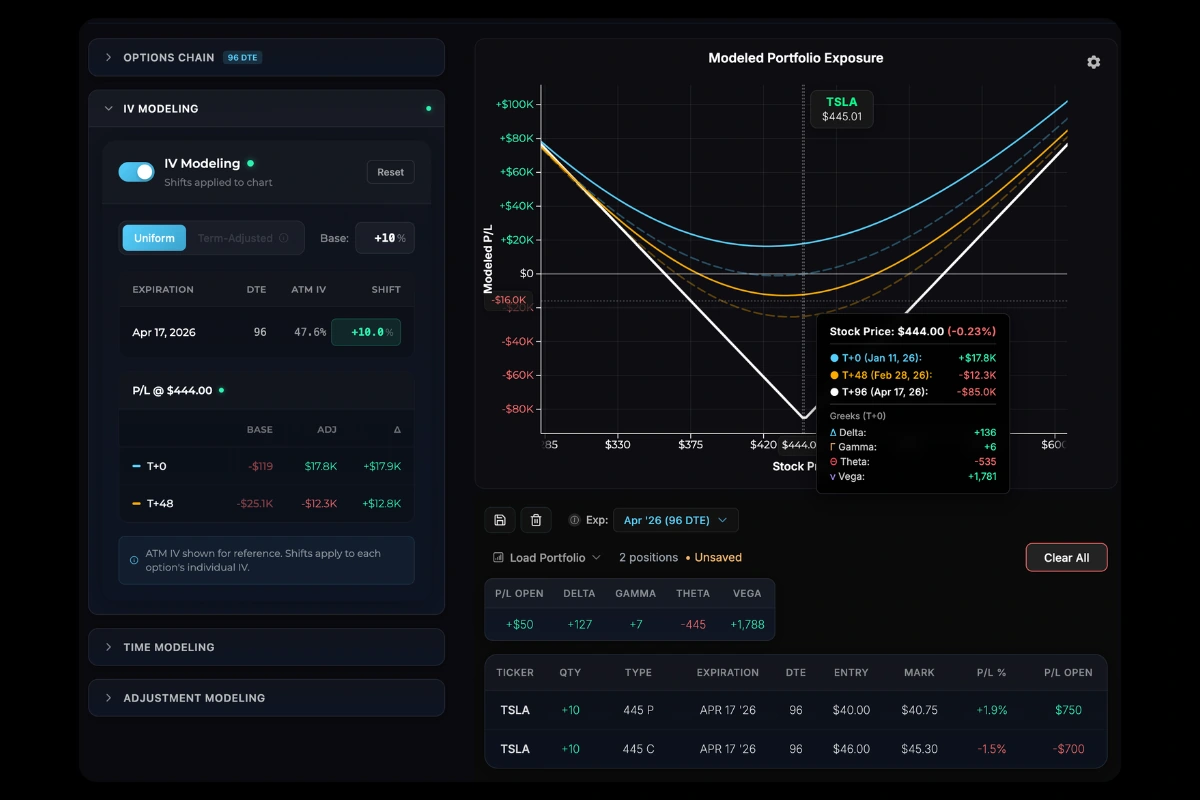
Model implied volatility changes vs. time and the stock price.
Shift IV up or down and see how your P/L would change if volatility spikes or crushes. Combine IV shifts with time modeling to simulate IV impact at different points in time.
Learn options without risking real money
- Build real-world stock and options positions.
- See how P/L would change over days and weeks.
- Experiment with adjustments and see how they would have changed your outcomes.
- All with live market data, but without putting capital at risk.
Everything you need to model options trades
Live Options Chain
Browse live options data for 4,000+ U.S. equities and ETFs. Filter by expiration and strike range.
Multi-Leg Positions
Build any strategy: spreads, poor man's covered calls, iron condors, or multi-strategy positions of any stock/option combination.
Live P/L Curves
See your position's modeled P/L across all stock prices and at any point in time. Updating live with the market.
T+ Time Modeling
Project your P/L curve forward to any future date before expiration.
IV Modeling
Simulate implied volatility increases or decreases with profit/loss differences from the baseline IV.
Adjustment Modeling
Add any adjustment and instantly compare current vs. adjusted P/L curves side by side.
Greeks Display
Delta, Gamma, Theta, and Vega for your full position at any price point.
Save & Load Portfolios
Save unlimited portfolios and load them instantly.
Market Coverage
Full coverage of U.S. equities and ETFs with live market data.
Simple, transparent pricing
Ready to start modeling your trades?
Get StartedOr try our free calculators