Live Options Chain
Browse live options data for 4,000+ U.S. stocks and ETFs. Filter by expiration and strike range.
See P/L curves over time, analyze roll and adjustment trades, identify covered call and cash-secured put trades, and scan for high-IV stocks, all in one options analysis platform.
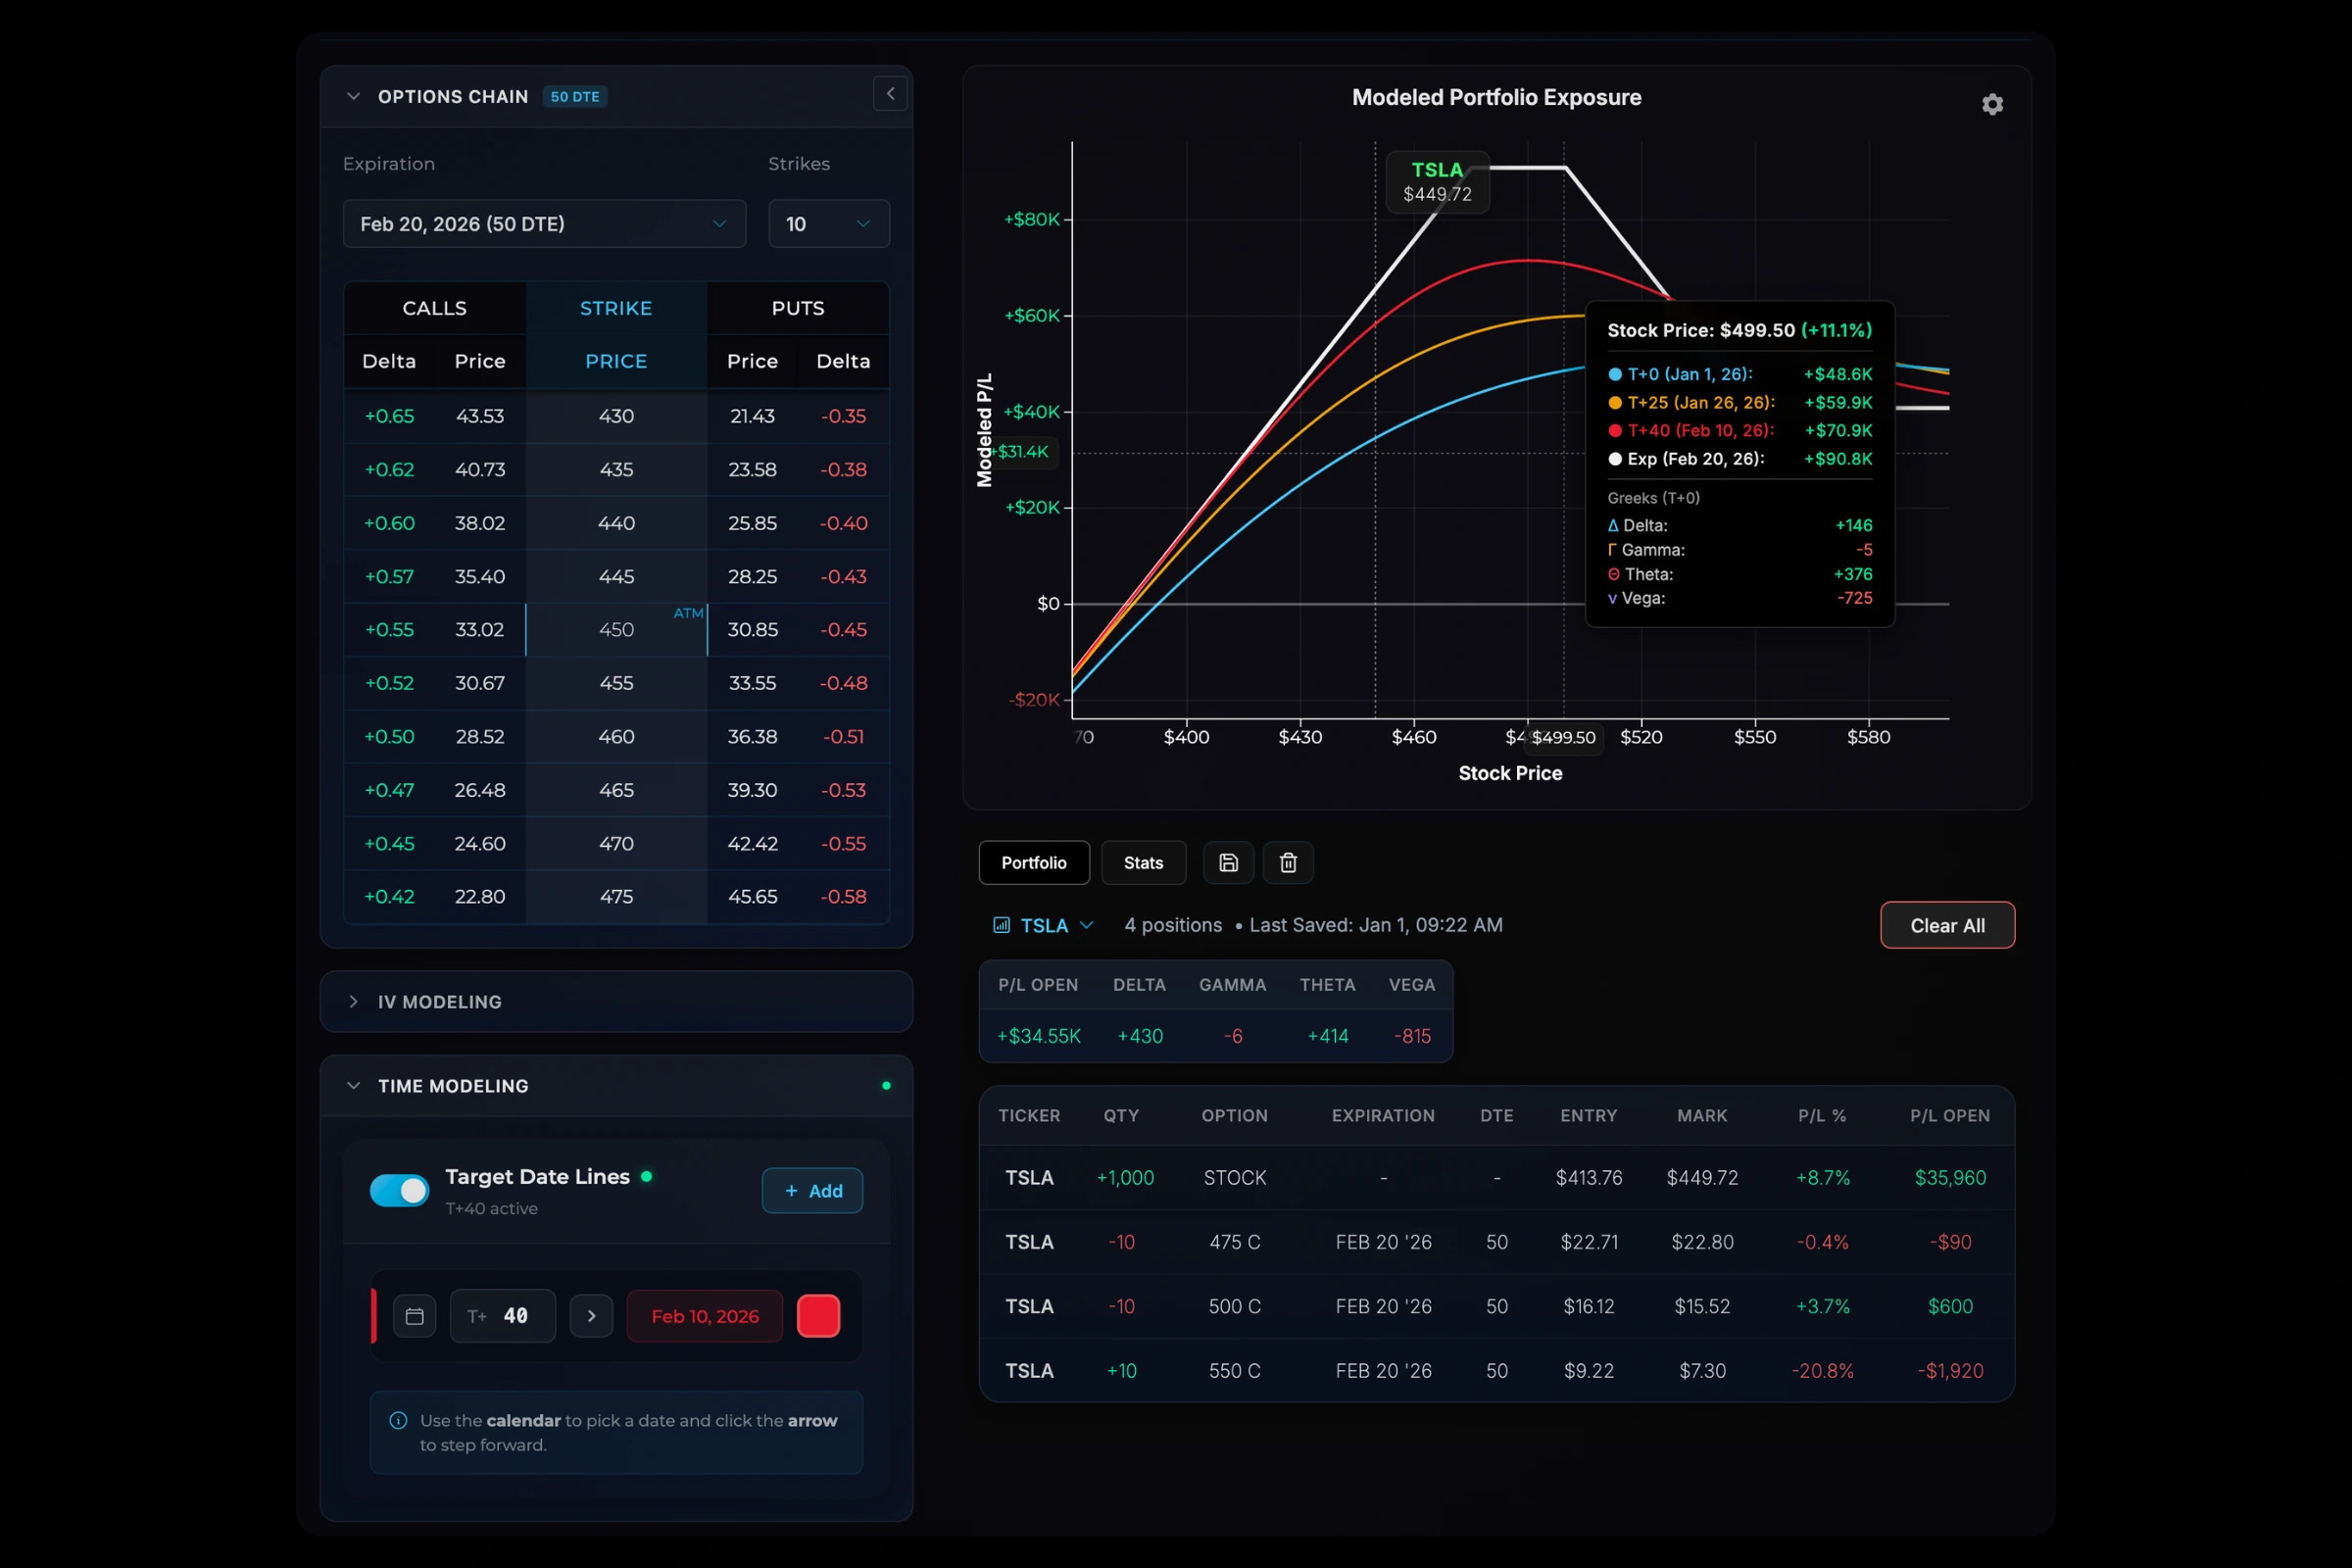
The expiration P/L of an options strategy is much different than what you'll get before expiration. Plug in any options strategy and see the position's expected P/L (and Greeks) at any point in time.
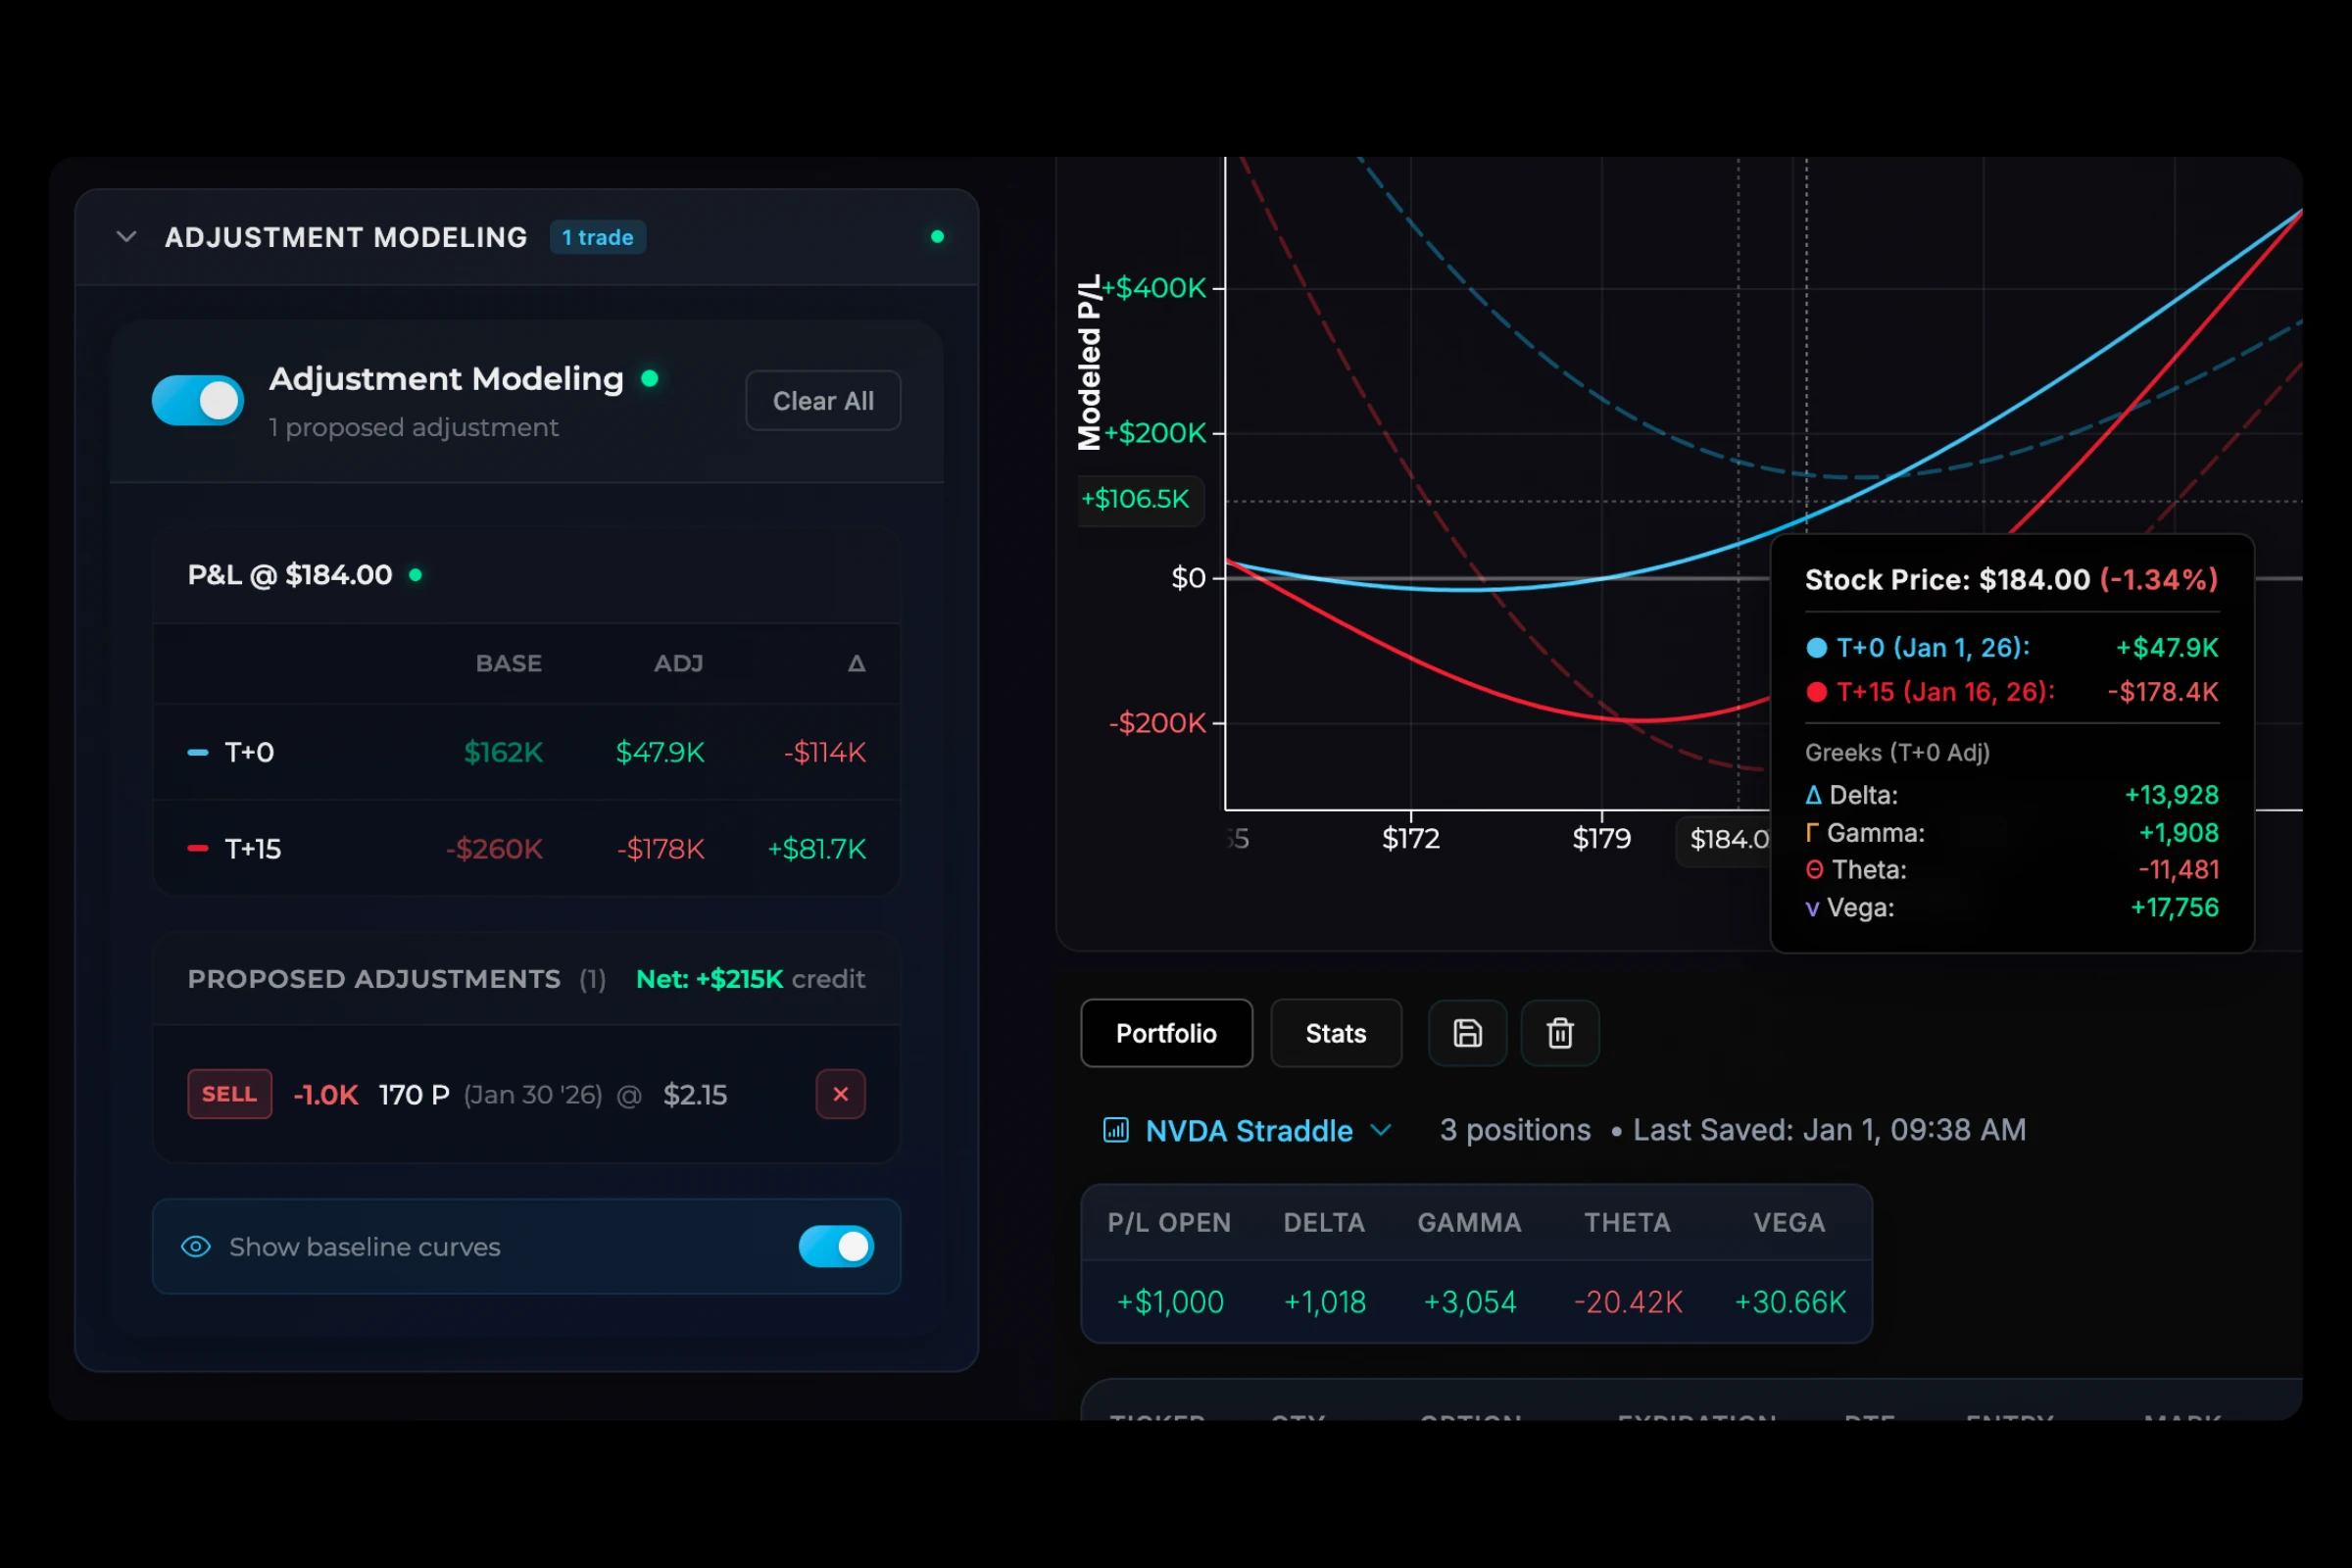
Add any trade adjustment and compare the current vs. adjusted P/L curves side-by-side. Quantify whether or not the adjustment helps your position the way you want it to.
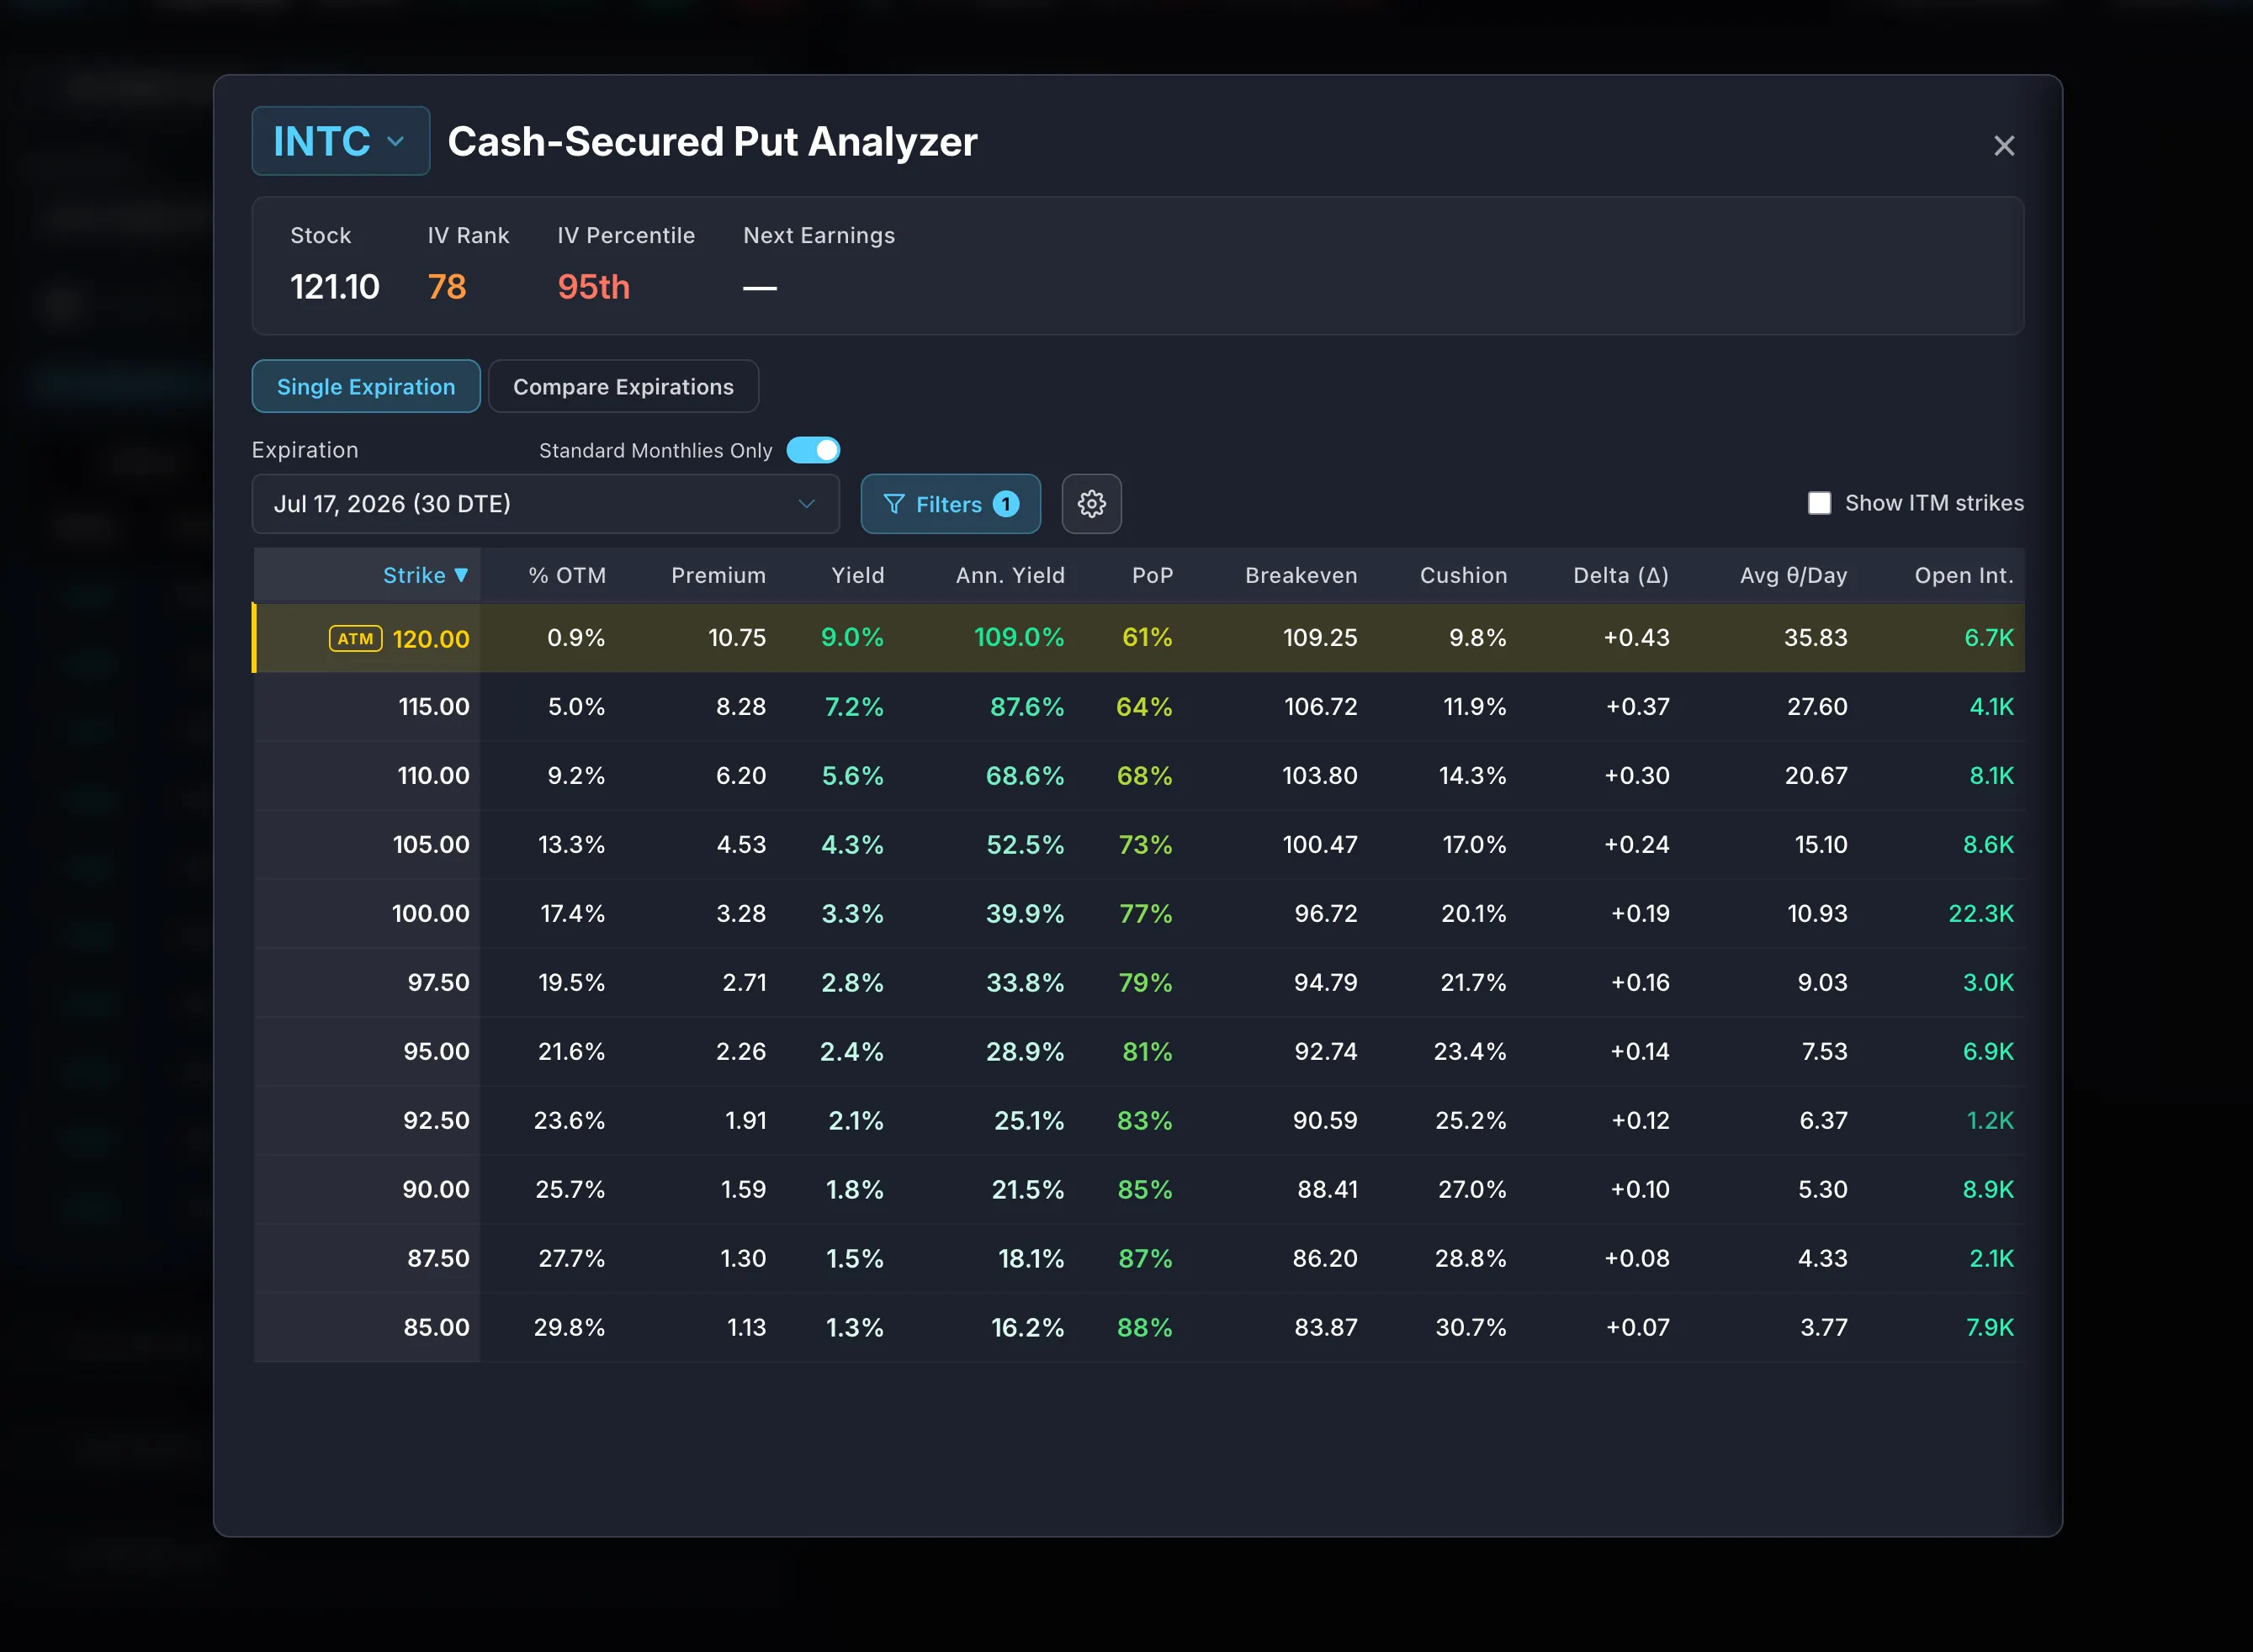
Use the Put and Covered Call analyzers to find high-yield income opportunities. Filter by yield potential and probability of profit to quickly identify attractive setups.
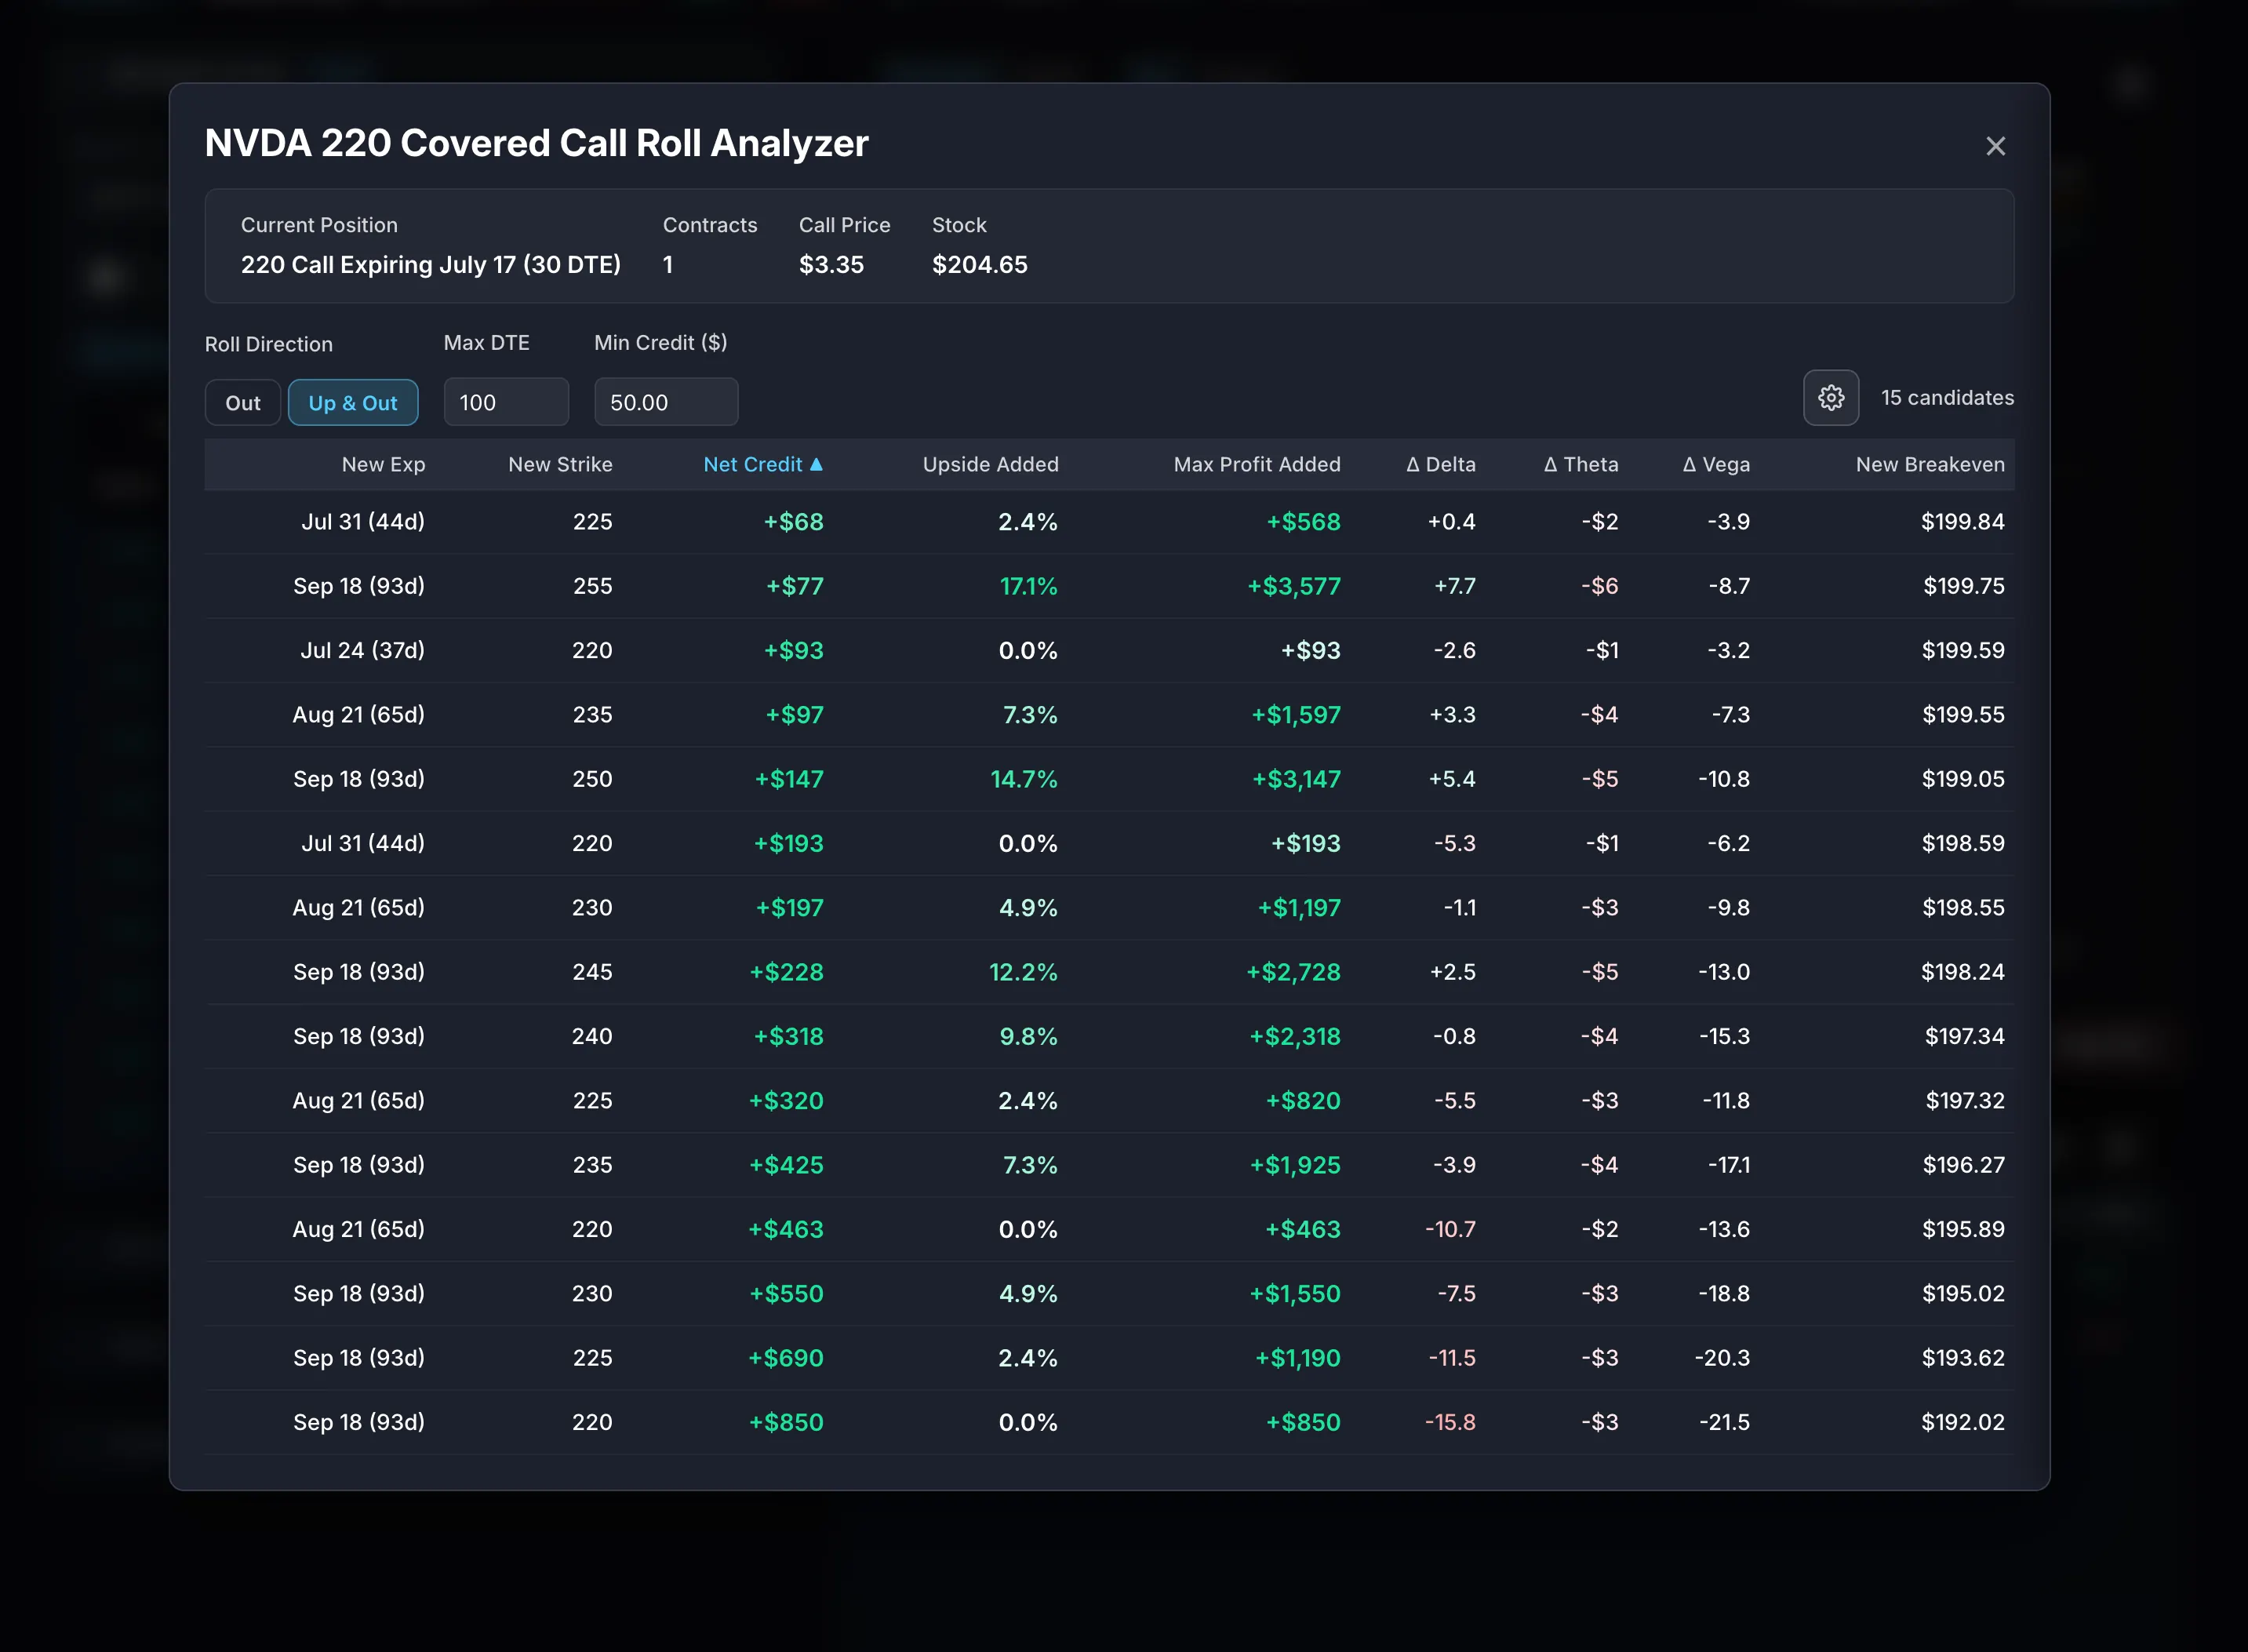
See which strikes and expirations you can roll to for a net credit, plus how much extra upside and max profit you gain.
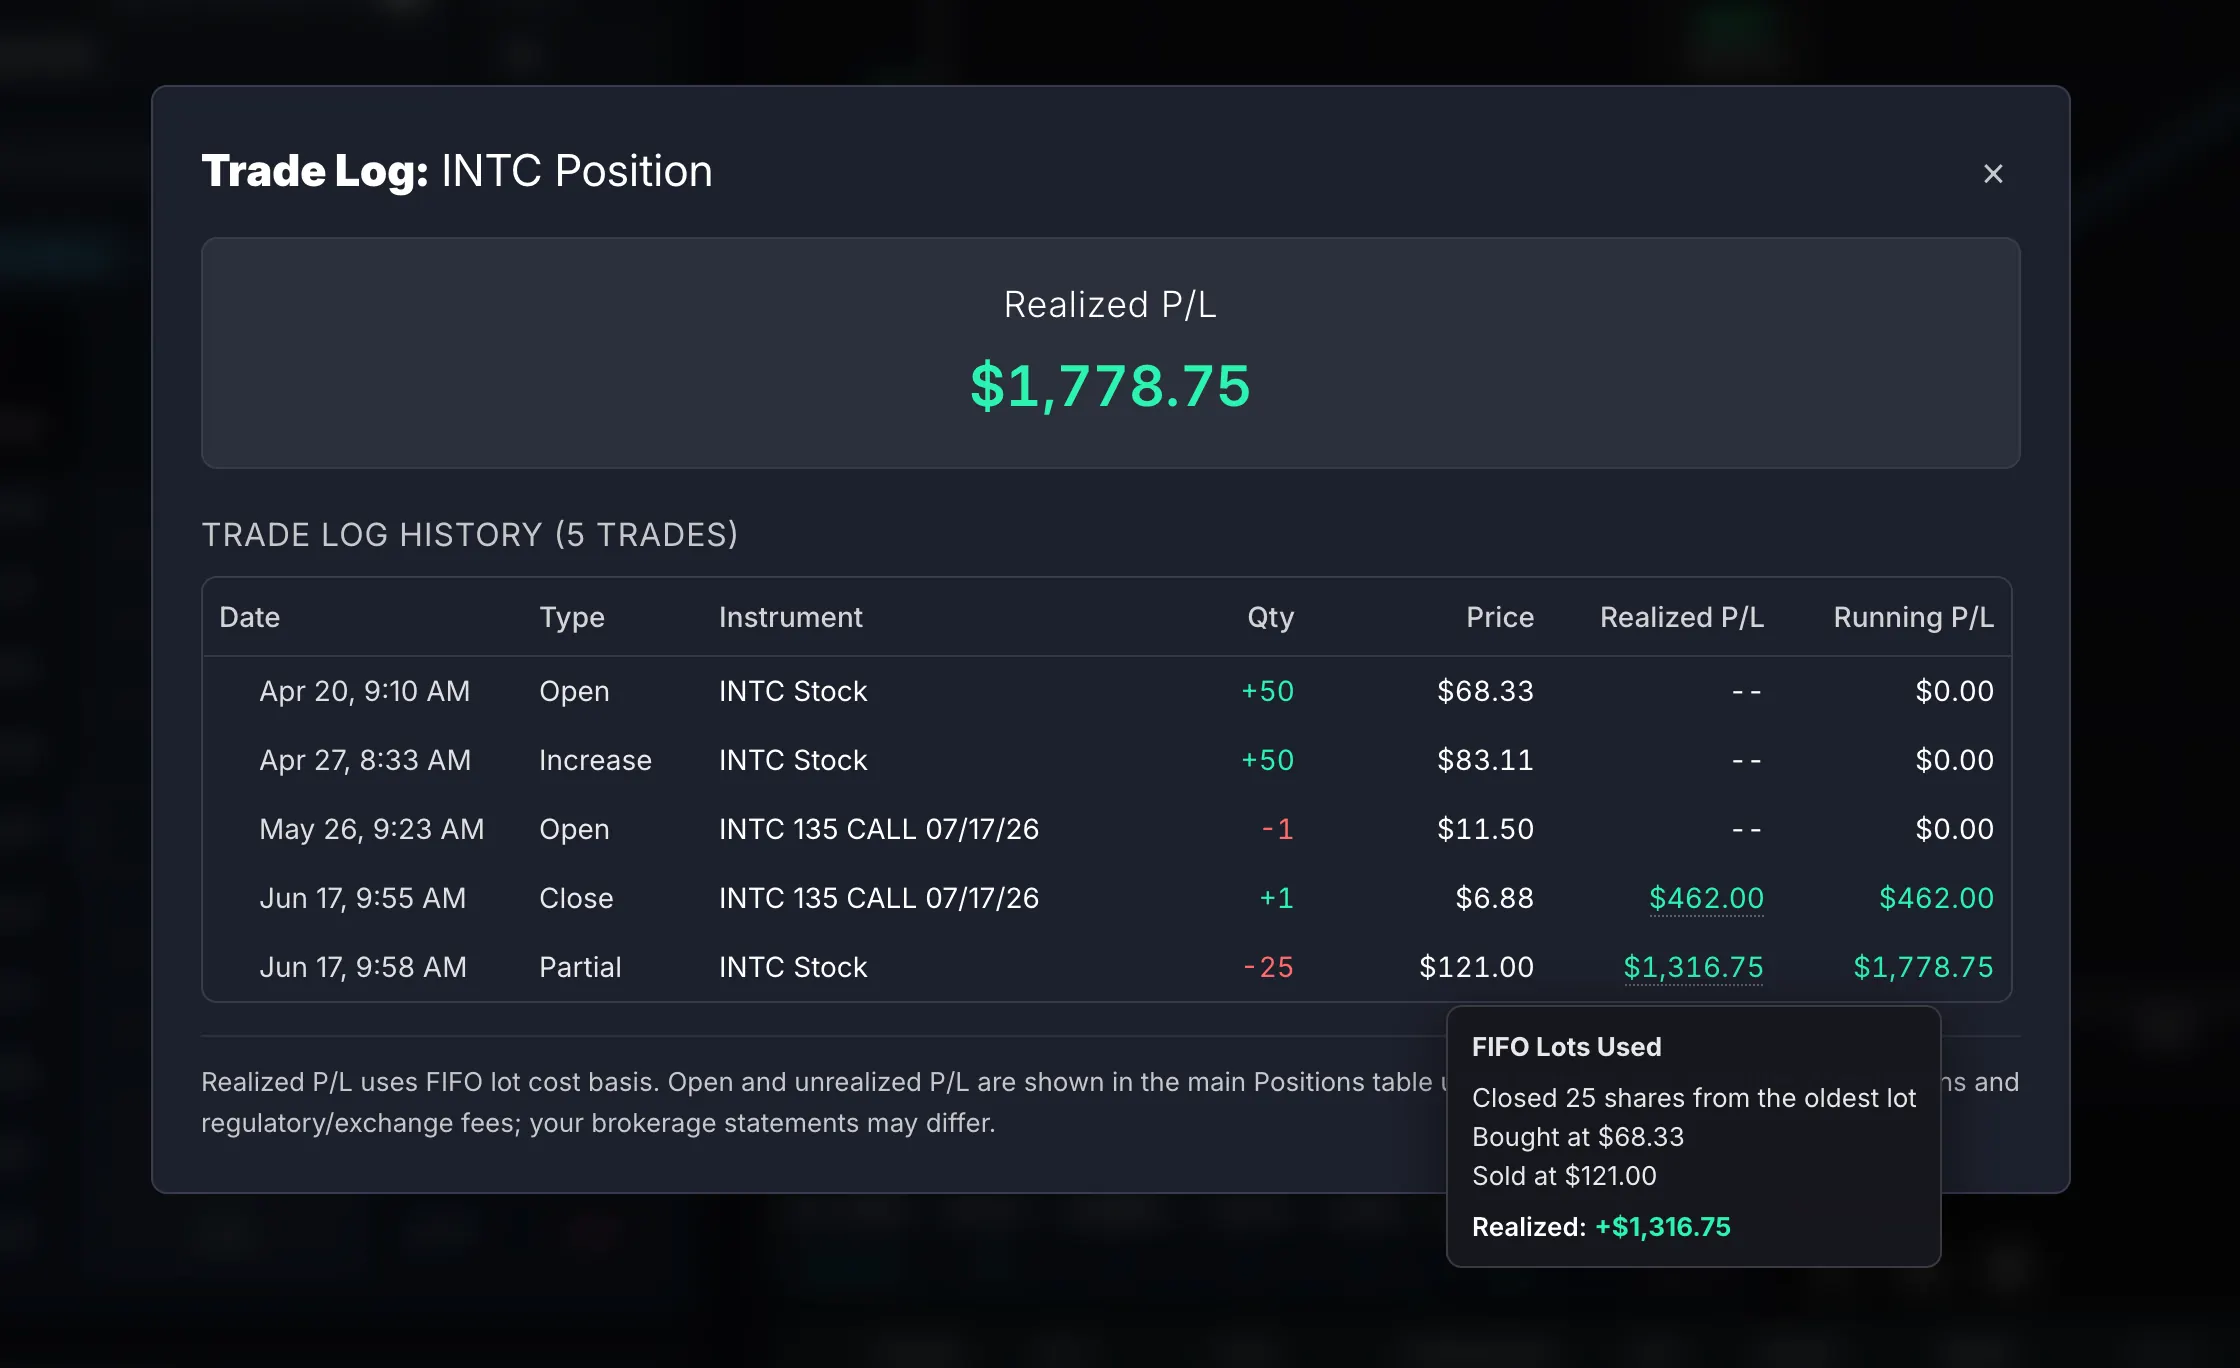
Running covered calls or the Wheel? The Trade Logger records every open and closed trade so you can see your running P/L based on your logged trades, without managing spreadsheets.
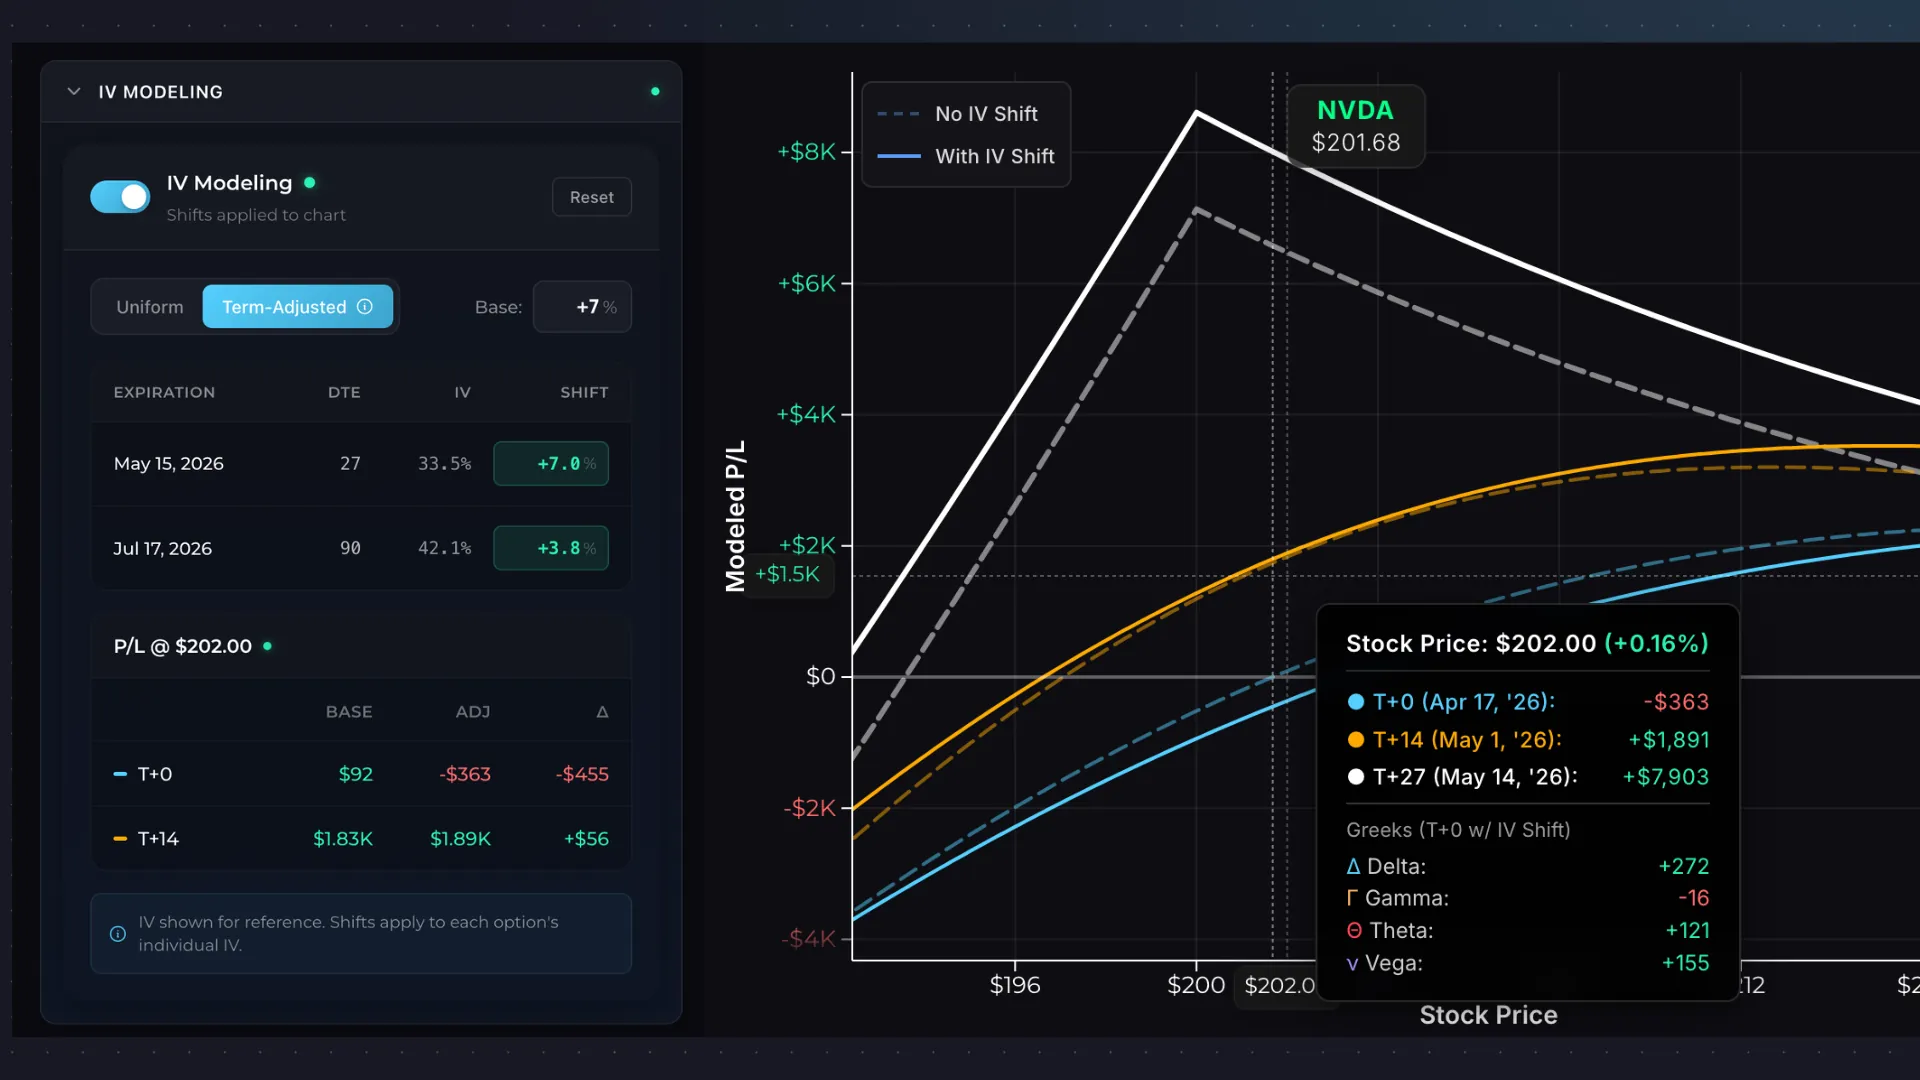
Change the implied volatility to see how much your position is exposed to increases or decreases in IV, with before-and-after P/L curves.
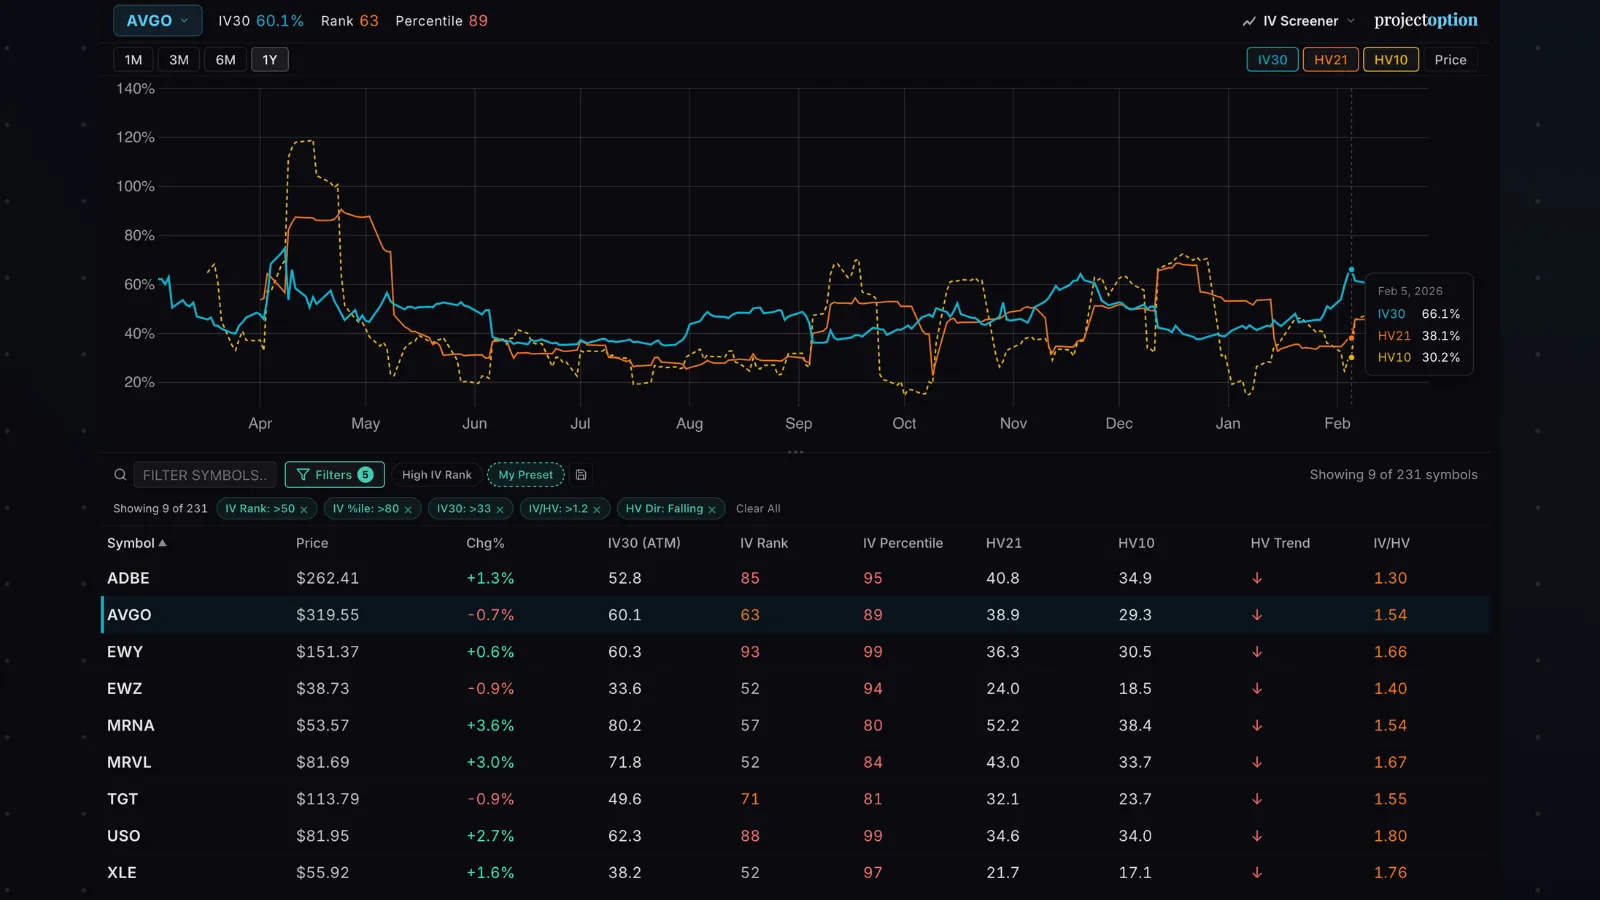
Scan stocks and ETFs by IV rank, IV percentile, and historical volatility trends.
A walkthrough of the platform, from adding your first position to analysis features.
Browse live options data for 4,000+ U.S. stocks and ETFs. Filter by expiration and strike range.
Build anything: spreads, PMCCs, iron condors, or any custom stock and option combo.
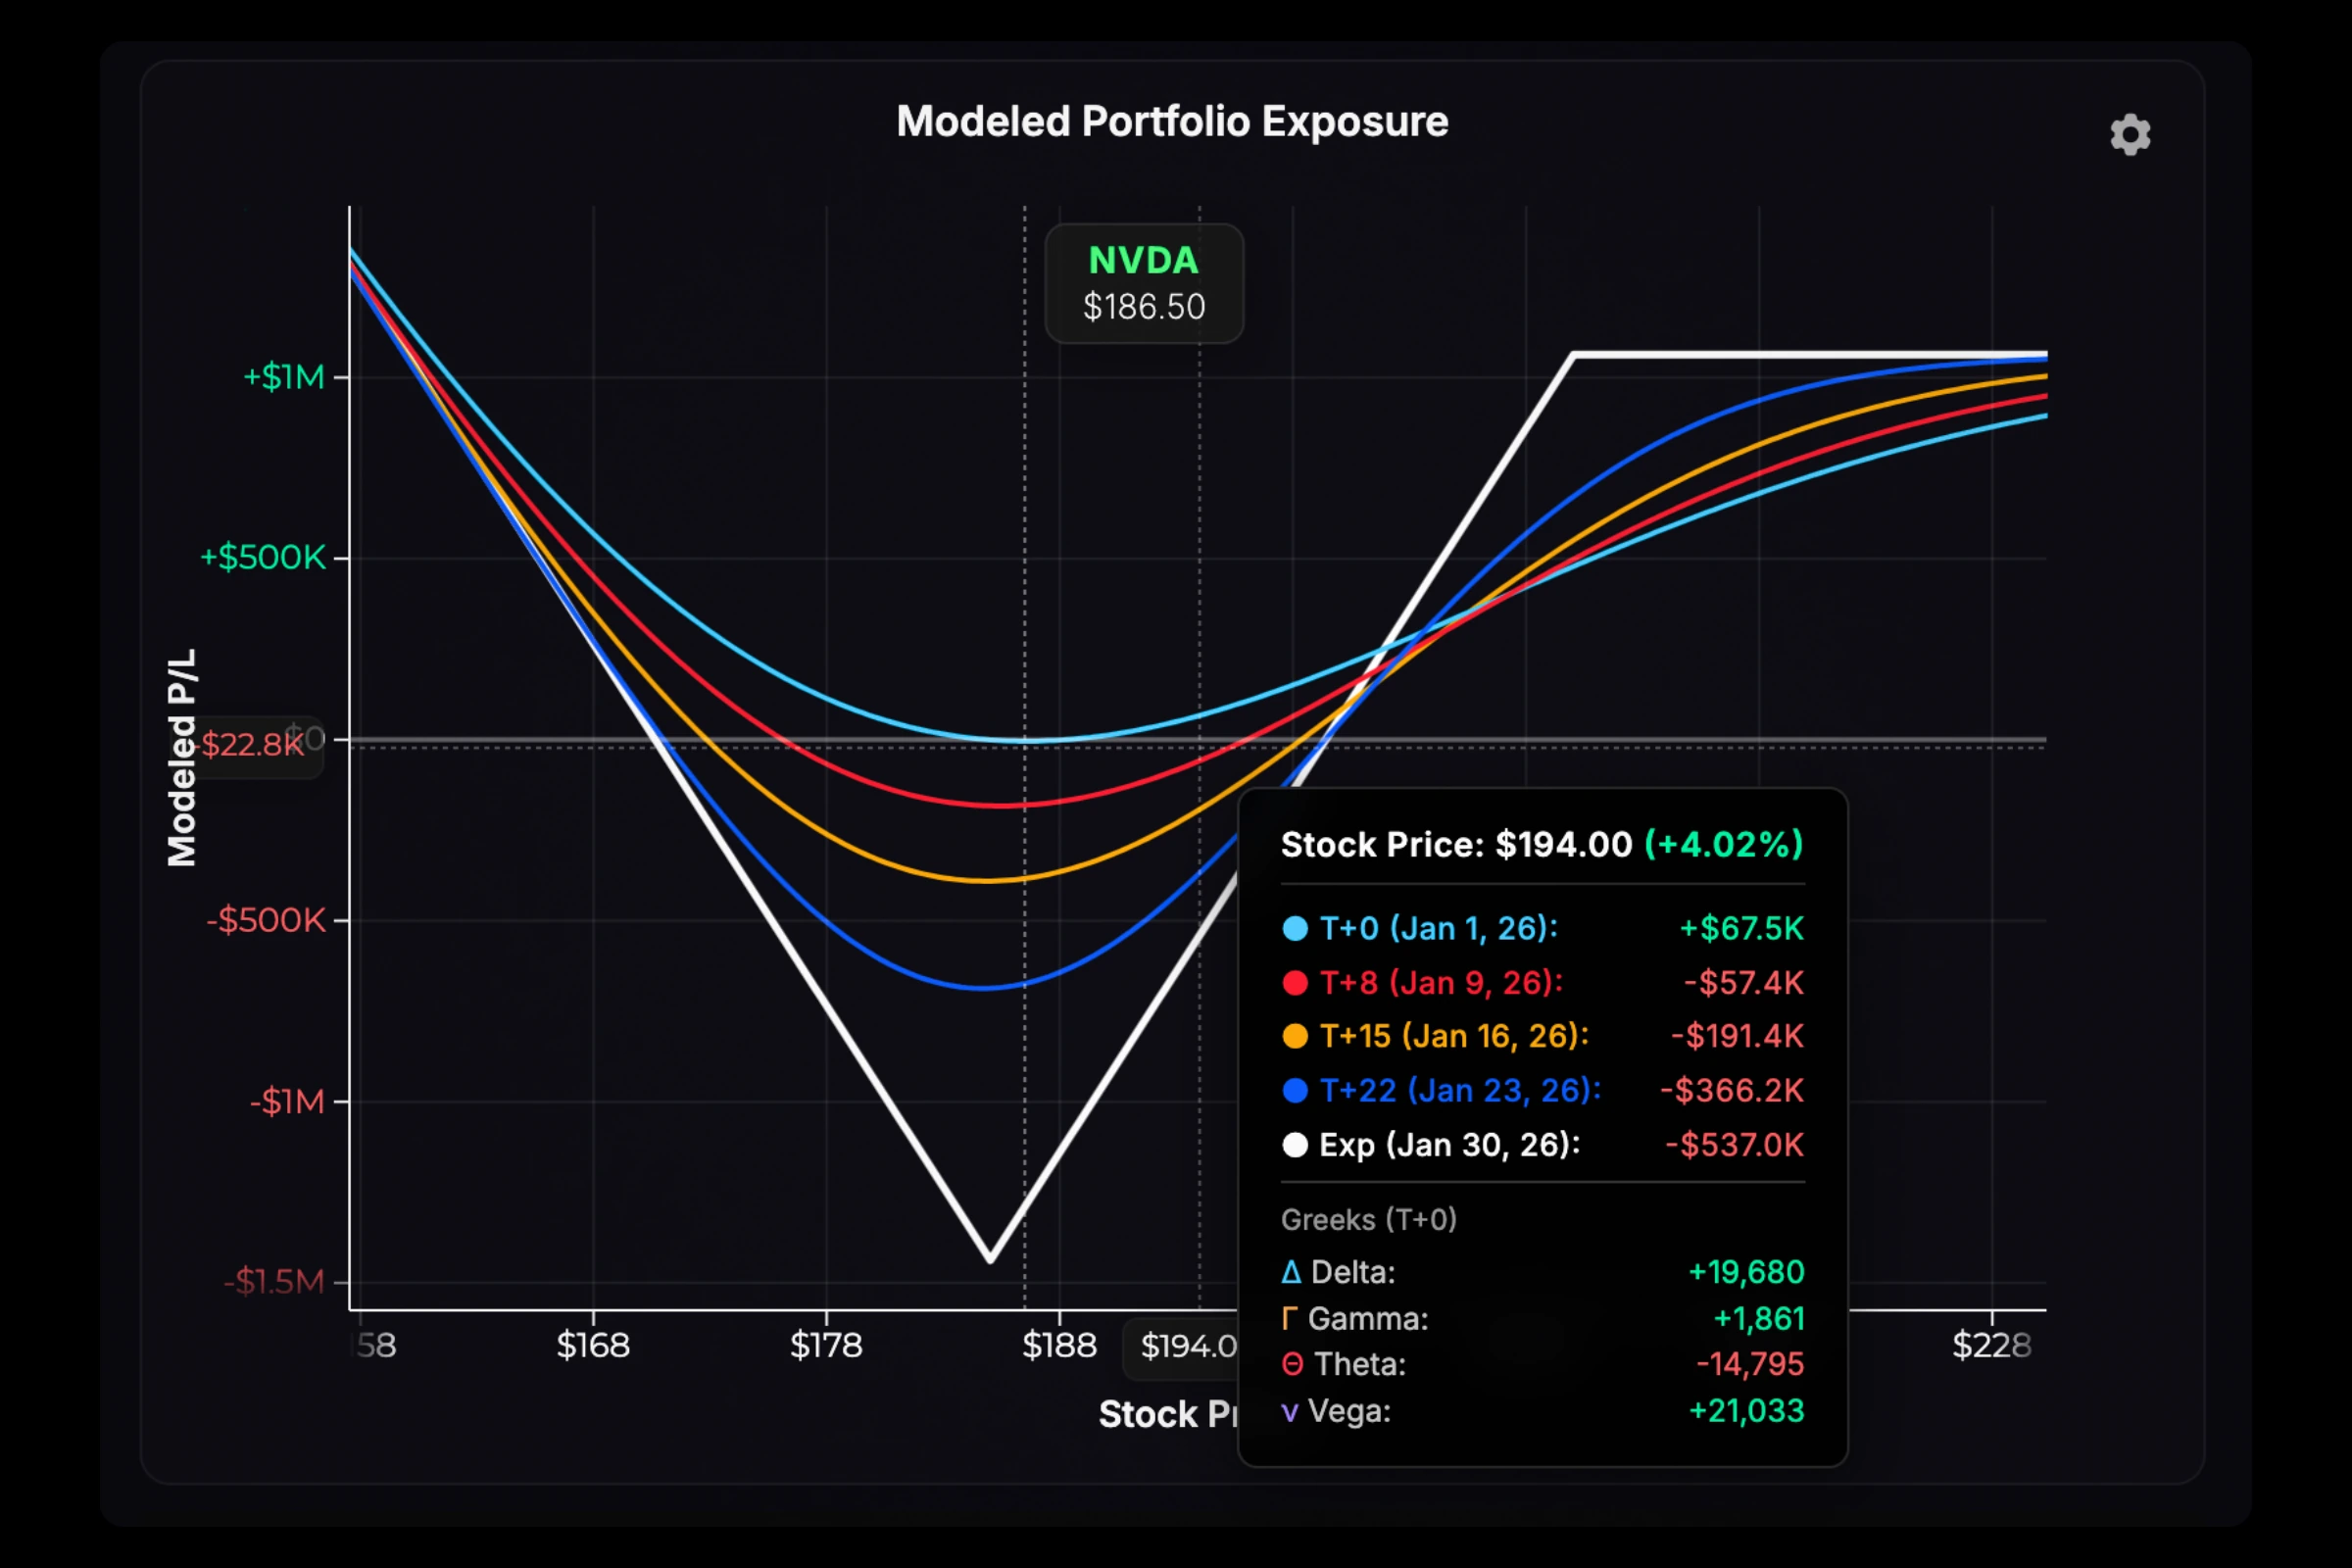
See the P/L at every possible stock price. Updates live so you're never looking at stale numbers.
Project the P/L curve forward to any date before expiration.
See how your position holds up if IV rises or falls from here.
Add adjustments and compare the new payoff to the existing one. Hover over the chart to see the exact dollar difference at any price.
Delta, Gamma, Theta, and Vega at any price point on the curve.
Save unlimited portfolios. Load them instantly.
Live data for 4,000+ U.S. stocks and ETFs.
New traders who want to visualize a position's payoff before entering the trade, and simulate/paper trade with a visual interface.
Traders who want to analyze different trade setups to find optimal payoff shapes. "What if I add an extra downside put to my iron condor?"
Traders who want to quantify how a position adjustment changes their payoff at any stock price.
Everything needed to model and analyze options trades.
Common questions from traders.
If the tools aren't helpful, email [email protected] within 30 days of signup and we'll refund you.
Everything on this page. Position modeling with live data, IV screener across 300+ tickers, unlimited saved positions.
All major credit cards (Visa, Mastercard, American Express) through Stripe, our secure payment processor.
Yes. Card details are never stored. Payments are processed securely through Stripe, which is PCI-DSS compliant.
Email [email protected]. Typical response time is within 24 hours.
Yes, cancel anytime from account settings. Access continues until the end of the billing period.