Straddle Calculator
Visualize the profit and loss for long and short straddle positions.
Straddle Parameters
Key Metrics
Enter parameters and calculate to see results.
Enter parameters and calculate to view P/L chart
Free 160-Page Options Guide
Clear visuals and real examples for every essential concept.
What Is a Straddle?
The straddle is the combination of a call and put at the same strike price with the same expiration. Straddles can be bought (long straddle) or sold (short straddle).
Long straddles pay a debit and profit from big moves in either direction. Short straddles collect a credit and profit when the stock stays near the strike price.
Long Straddle
A long straddle consists of buying a call and a put at the same strike, typically at-the-money. You pay a debit at entry and profit when the stock moves far enough in either direction to overcome the cost.
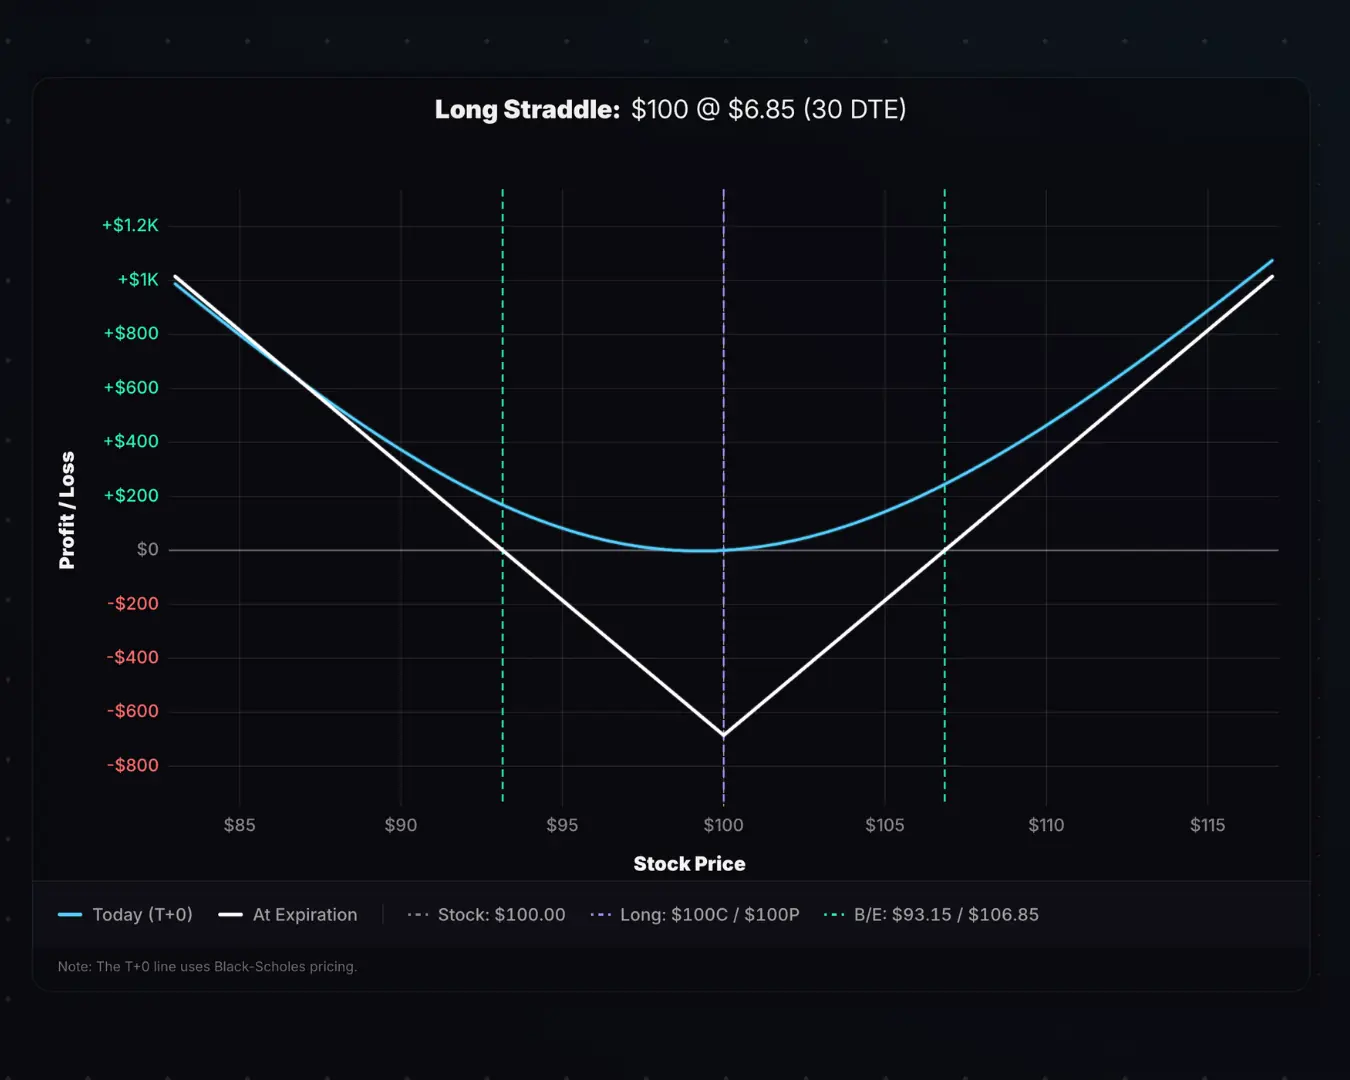
Time decay works against you: both options lose value each day the stock doesn't move enough in either direction. Long straddles also benefit from rising implied volatility.
Key Characteristics
- Max Profit: Unlimited on the upside; strike price − debit on the downside.
- Max Loss: Debit paid. Occurs when the stock closes exactly at the strike at expiration.
- Breakevens: Strike ± debit
- Outlook: Expecting a large move but unsure of direction, or expecting IV to increase
Short Straddle
A short straddle consists of selling a call and a put at the same strike. You collect a credit at entry and profit when the stock closes near the strike at expiration.
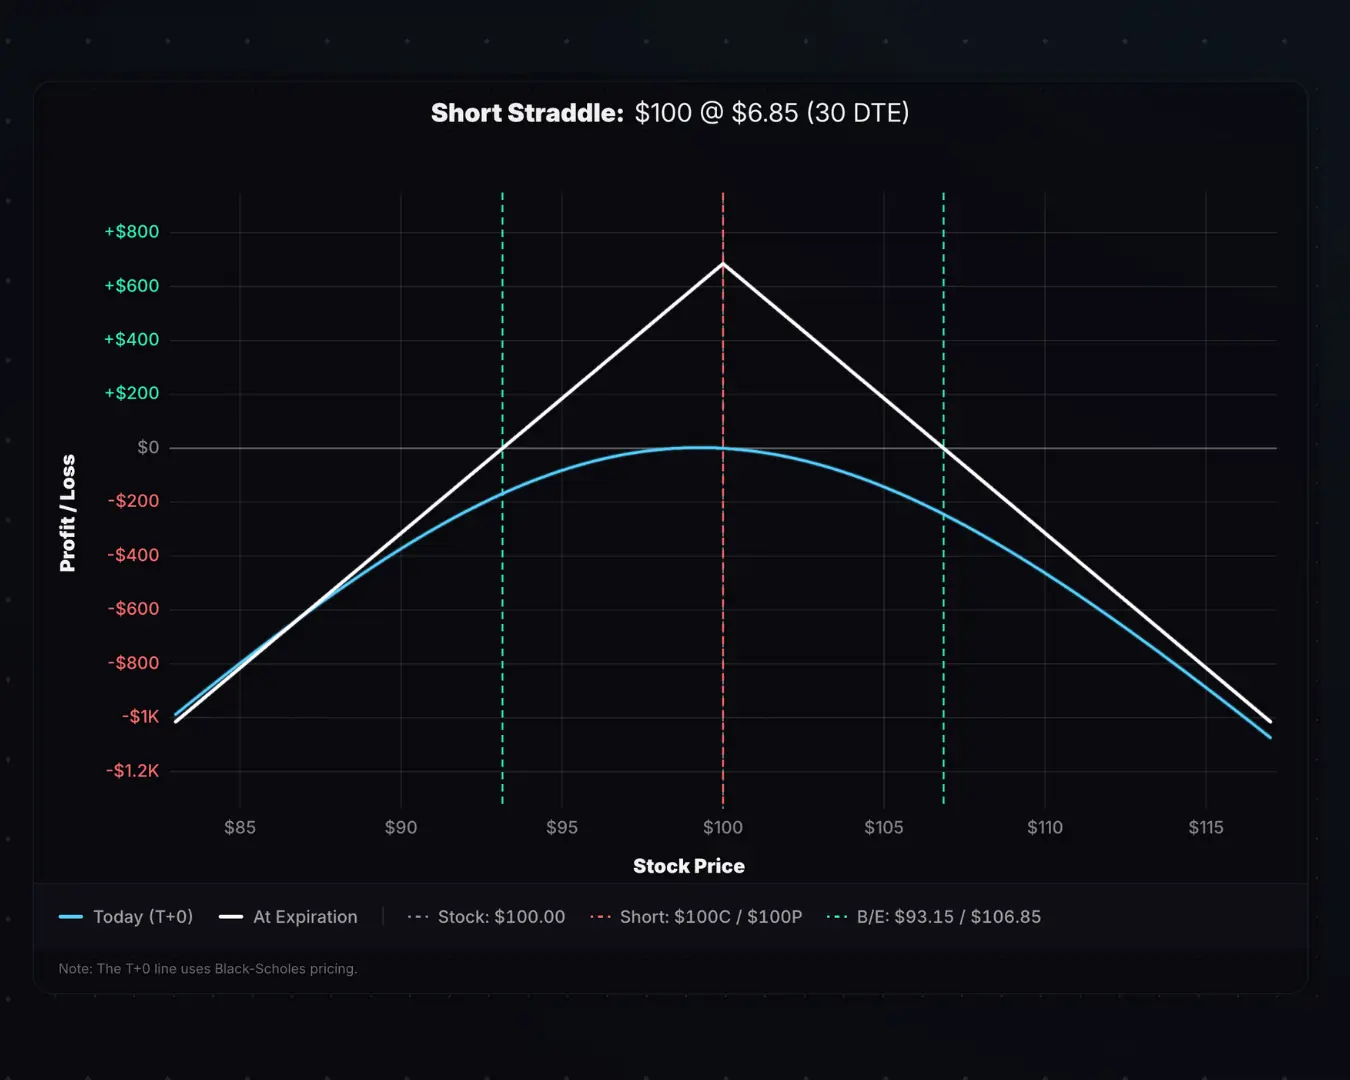
Time decay works in your favor as both options lose value each day. Short straddles also benefit from falling implied volatility: if IV drops after entry, both options become cheaper and you can close the trade for a profit.
Key Characteristics
- Max Profit: Credit received. Achieved when the stock closes exactly at the strike at expiration.
- Max Loss: Unlimited on the upside; strike price − credit on the downside.
- Breakevens: Strike ± credit
- Outlook: Neutral: expecting the stock to stay in a tight range, or IV to fall
Reading the P/L Chart
The white line (Expiration) shows the P/L at expiration. For a short straddle, it peaks at the strike, where both options expire worthless and you keep the full credit. For a long straddle, the expiration P/L is max loss at the strike and increases as the stock moves in either direction.
The cyan line (T+0) shows the theoretical P/L today. The gap between the two lines represents extrinsic value yet to decay. As expiration approaches, the cyan line converges toward the white line.
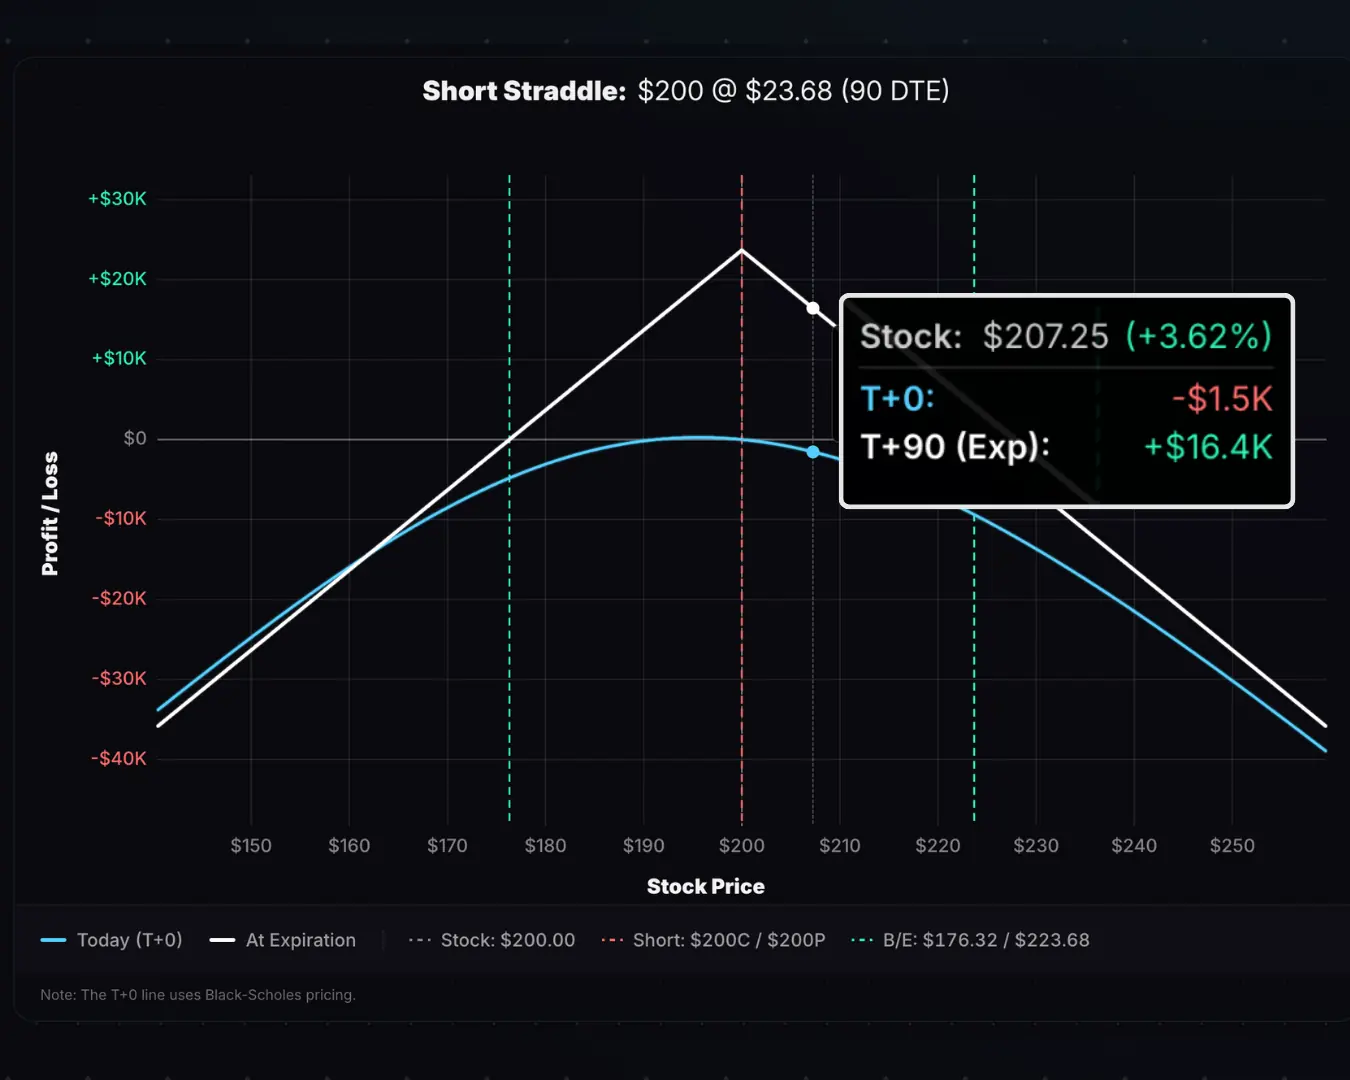
Realistic Expectations
Short straddles achieve max profit only if the stock pins the strike exactly at expiration (extremely unlikely). Plan to close at 25–50% of max profit rather than holding for the full credit.
Long straddles rarely hit max loss for the same reason. But straddles are expensive, and a 50%+ loss on the position can still be substantial even if it's not the theoretical maximum.
Straddle vs. Strangle
A straddle uses the same strike for both legs. A strangle uses different strikes: an OTM call and OTM put. Straddles cost more (for long) or collect more credit (for short) because both options are ATM. Strangles are cheaper but require a bigger move to profit.
Assignment Risk
Short straddles carry assignment risk. If assigned early or at expiration, your short option converts into a stock position:
| Assigned Option | Resulting Position | Combined With Remaining Leg |
|---|---|---|
| Short Put (ITM) | +100 shares | Covered call |
| Short Call (ITM) | −100 shares | Covered put |
Early assignment becomes likely only when the ITM option has little extrinsic value remaining, or when a short ITM call approaches an ex-dividend date. If the option still has meaningful extrinsic value, early assignment is unlikely.
If held through expiration, whichever option is ITM will be exercised (long straddle) or assigned (short straddle). Plan to close or roll the position before expiration to avoid unwanted stock positions.
What Is a Short Straddle?: Full strategy guide with examples
What Is a Long Straddle?: Full strategy guide with examples
Related Calculators
- Strangle Calculator: OTM call and put at different strikes
- Iron Condor Calculator: Defined-risk strangle alternative
- Iron Butterfly Calculator: Defined-risk straddle alternative