What Is a Long Strangle?
Long strangle options strategy explained visually: payoff diagrams, Greeks tables, and examples showing how the strategy works.
A long strangle combines buying an out-of-the-money (OTM) call and an OTM put at different strike prices. Both options share the same expiration date. You pay a debit equal to the call premium plus the put premium. Buying strangles is a volatility strategy that profits when the stock makes a large move in either direction.
Long Strangle Example
If a stock is at $100, a long strangle would be:
- Buy one 105 call for $1.50
- Buy one 95 put for $1.50
- Total Debit: $3.00
The strangle makes money if the stock moves beyond $92 or $108 by expiration. The maximum profit is unlimited to the upside and substantial to the downside. The maximum loss occurs if the stock closes anywhere between $95 and $105 at expiration, and both options expire worthless.
Payoff Diagram
The long strangle payoff is flat between the strikes and slopes upward beyond them:
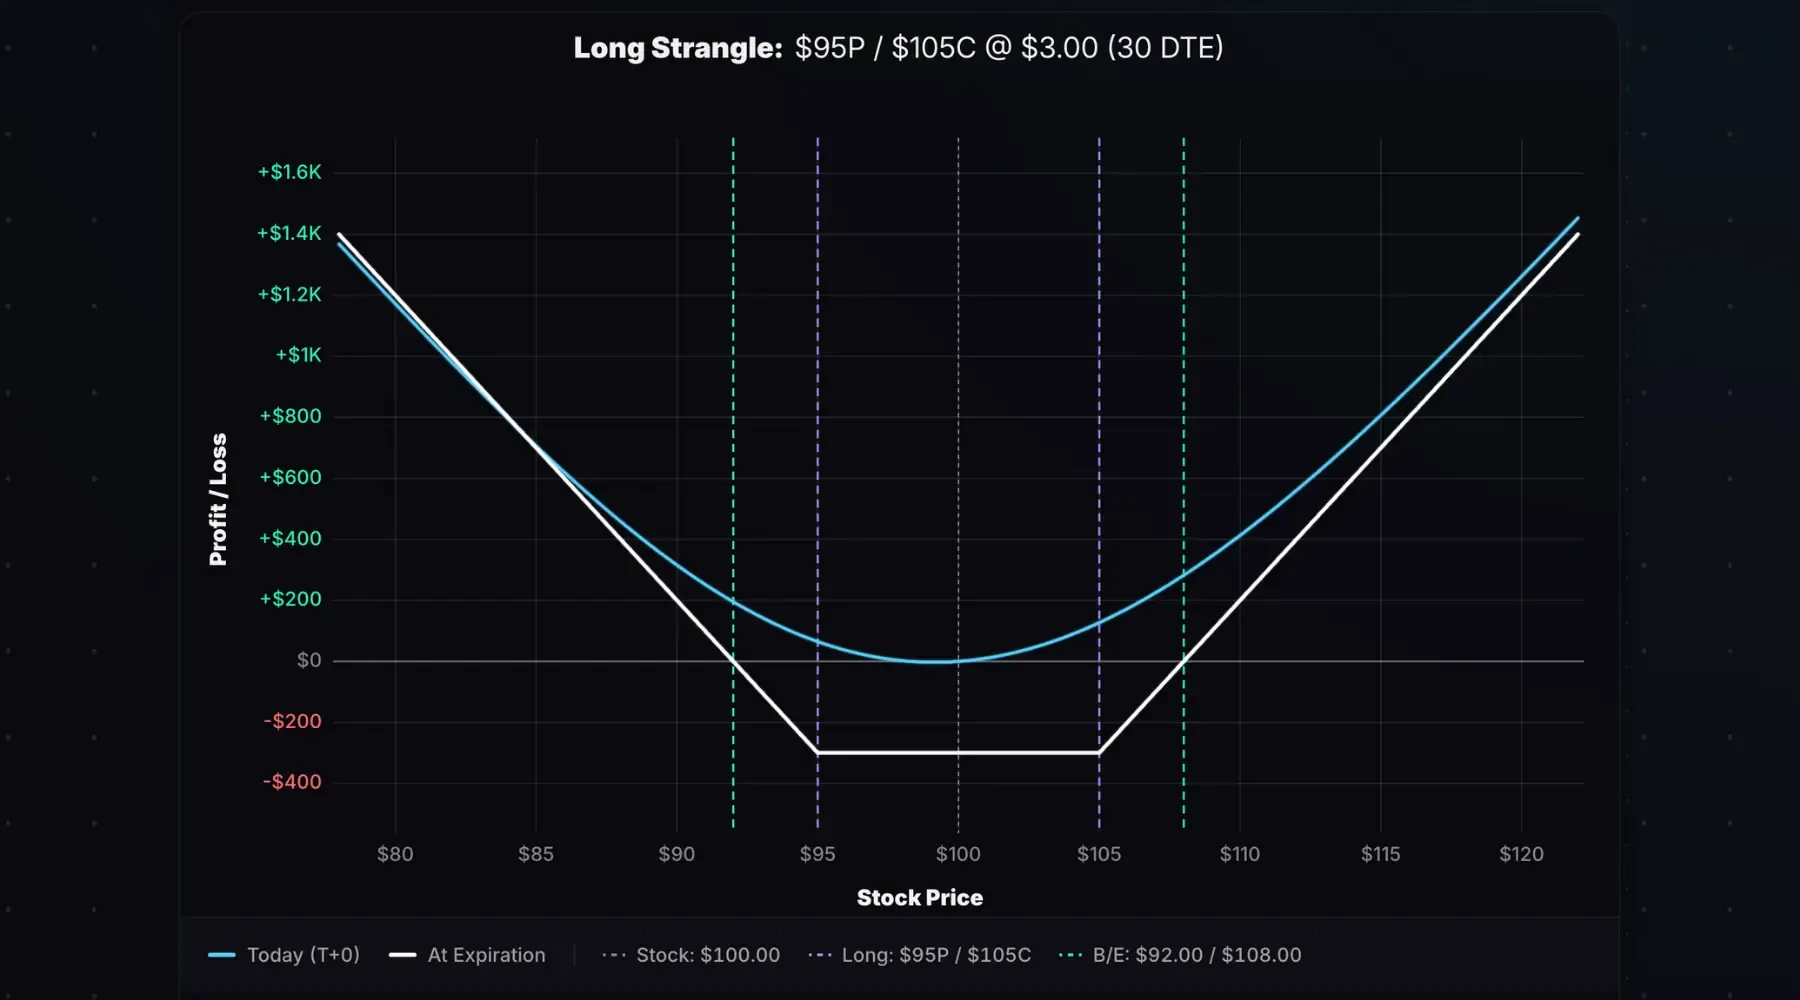
Stock at Entry: $100. Trade: Long 95/105 strangle entered for a $3.00 debit. 30 days to expiration (DTE).
The white line shows the payoff at expiration. The maximum loss of $300 occurs if the stock closes anywhere between $95 and $105 at expiration. Profits grow as the stock moves beyond either breakeven, with unlimited profit to the upside.
The cyan line (T+0) shows the modeled payoff at entry.
The gap between the two represents time decay working against you.
Key Characteristics
- Max Profit: Unlimited to the upside. To the downside, profit is capped at (put strike − total debit) × 100 (stock falls to zero).
- Max Loss: Total debit × 100. Occurs if the stock closes between the long strikes at expiration.
- Upper Breakeven: Call strike + total debit
- Lower Breakeven: Put strike − total debit
- Outlook: High volatility: expecting a large move in either direction
Here are the metrics for a 95/105 strangle bought for $3.00 debit:
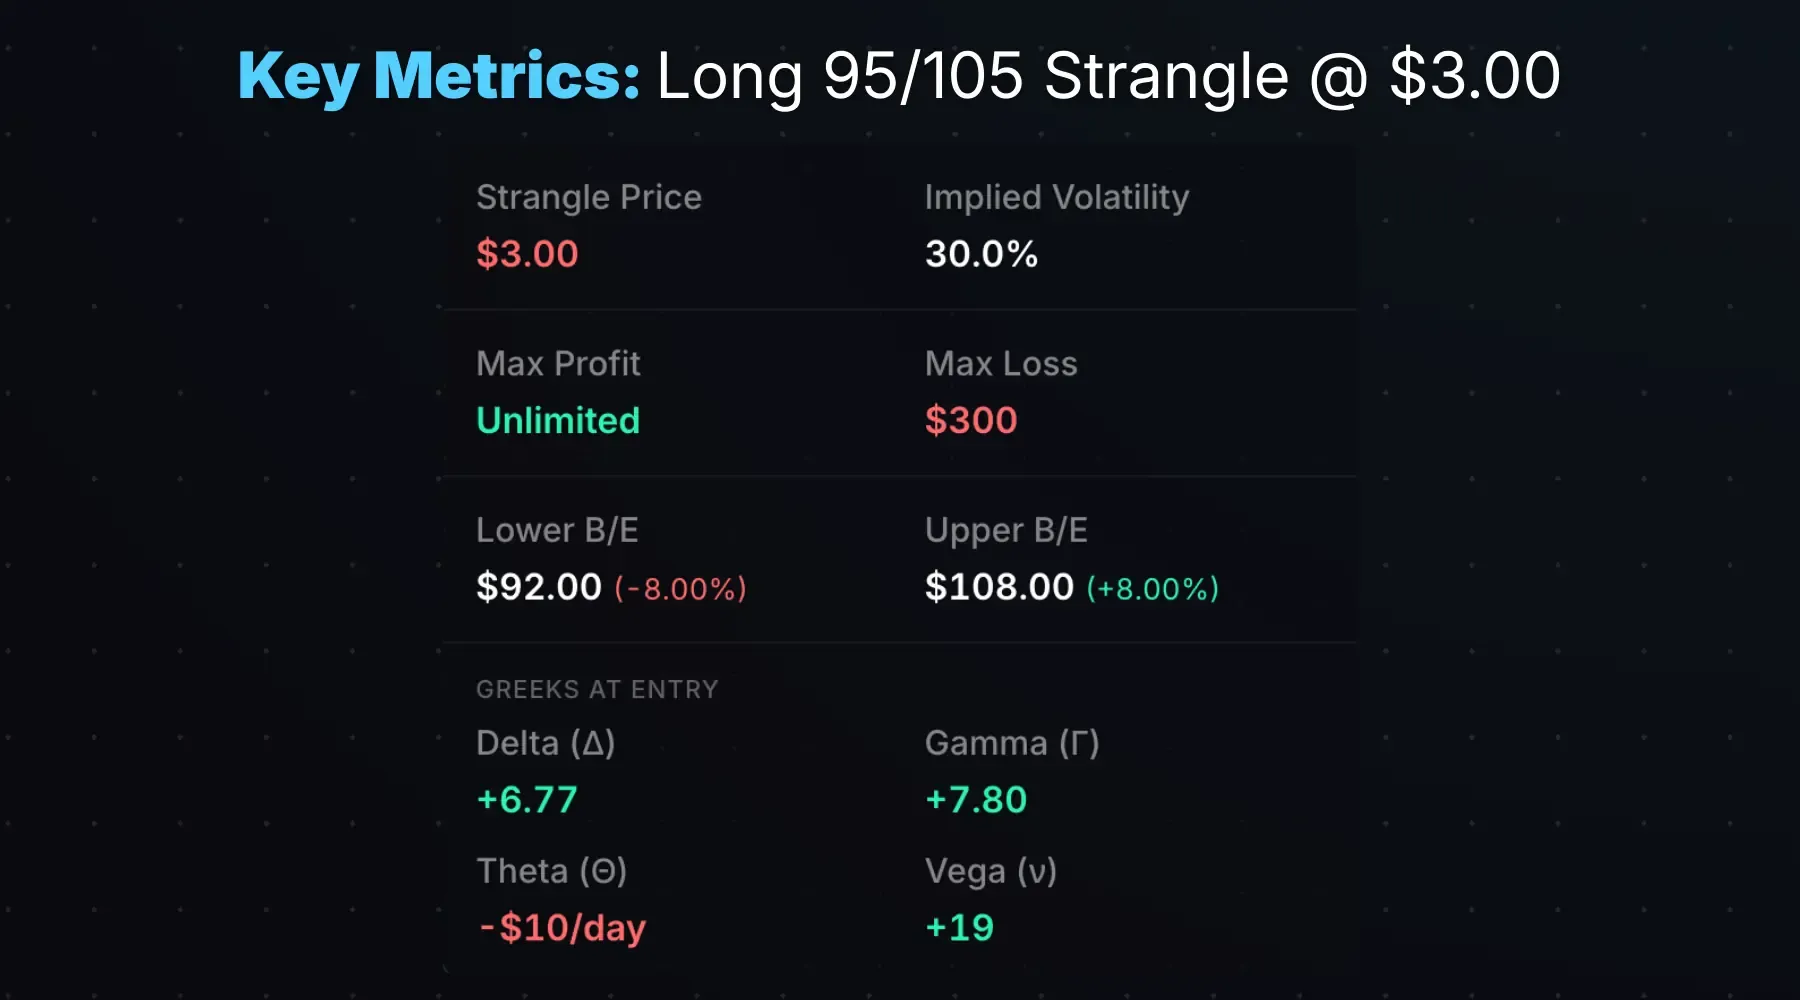
The breakevens of ±8% for this trade require a meaningful move to profit. You’re betting the stock will move more than the market expects.
How the Greeks Affect a Long Strangle
A long strangle has positive gamma, positive vega, and negative theta. Delta typically begins near zero, unless structured with a slight directional bias.
| Greek | Exposure | What It Means |
|---|---|---|
| Delta (Δ) | Near Zero | Market-neutral at entry |
| Gamma (Γ) | Positive | Delta shifts in your favor as the stock moves |
| Theta (Θ) | Negative | Time decay hurts the position |
| Vega (ν) | Positive | Rising IV helps; falling IV hurts |
Here’s a 45/55 long strangle on IBIT entered for a $2.48 debit with 52 DTE:
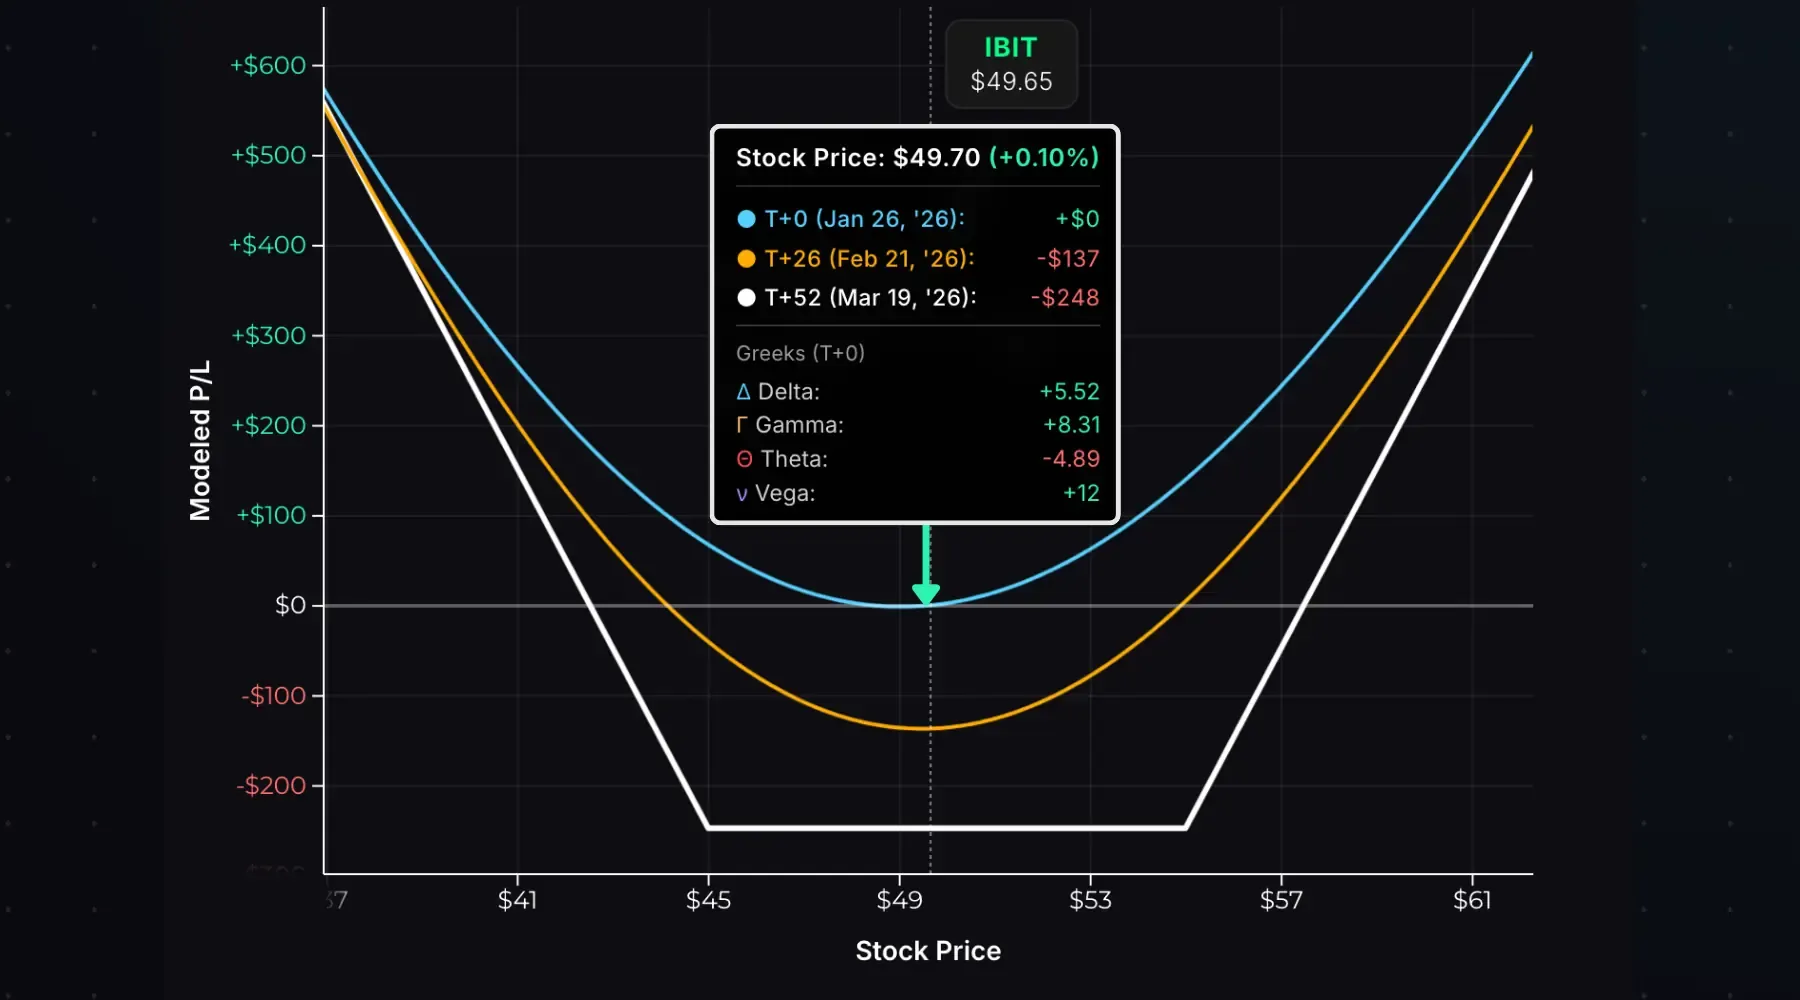
At entry, delta is +5.52, nearly neutral, with a slight bullish tilt since the call’s delta is marginally higher than the put’s. Gamma is +8.31, meaning the position picks up deltas quickly with any move. Theta is -4.89, costing roughly $5 per day while the stock stays between the strikes.
If the stock moves in either direction, delta shifts in your favor. Consider an immediate drop to $40:
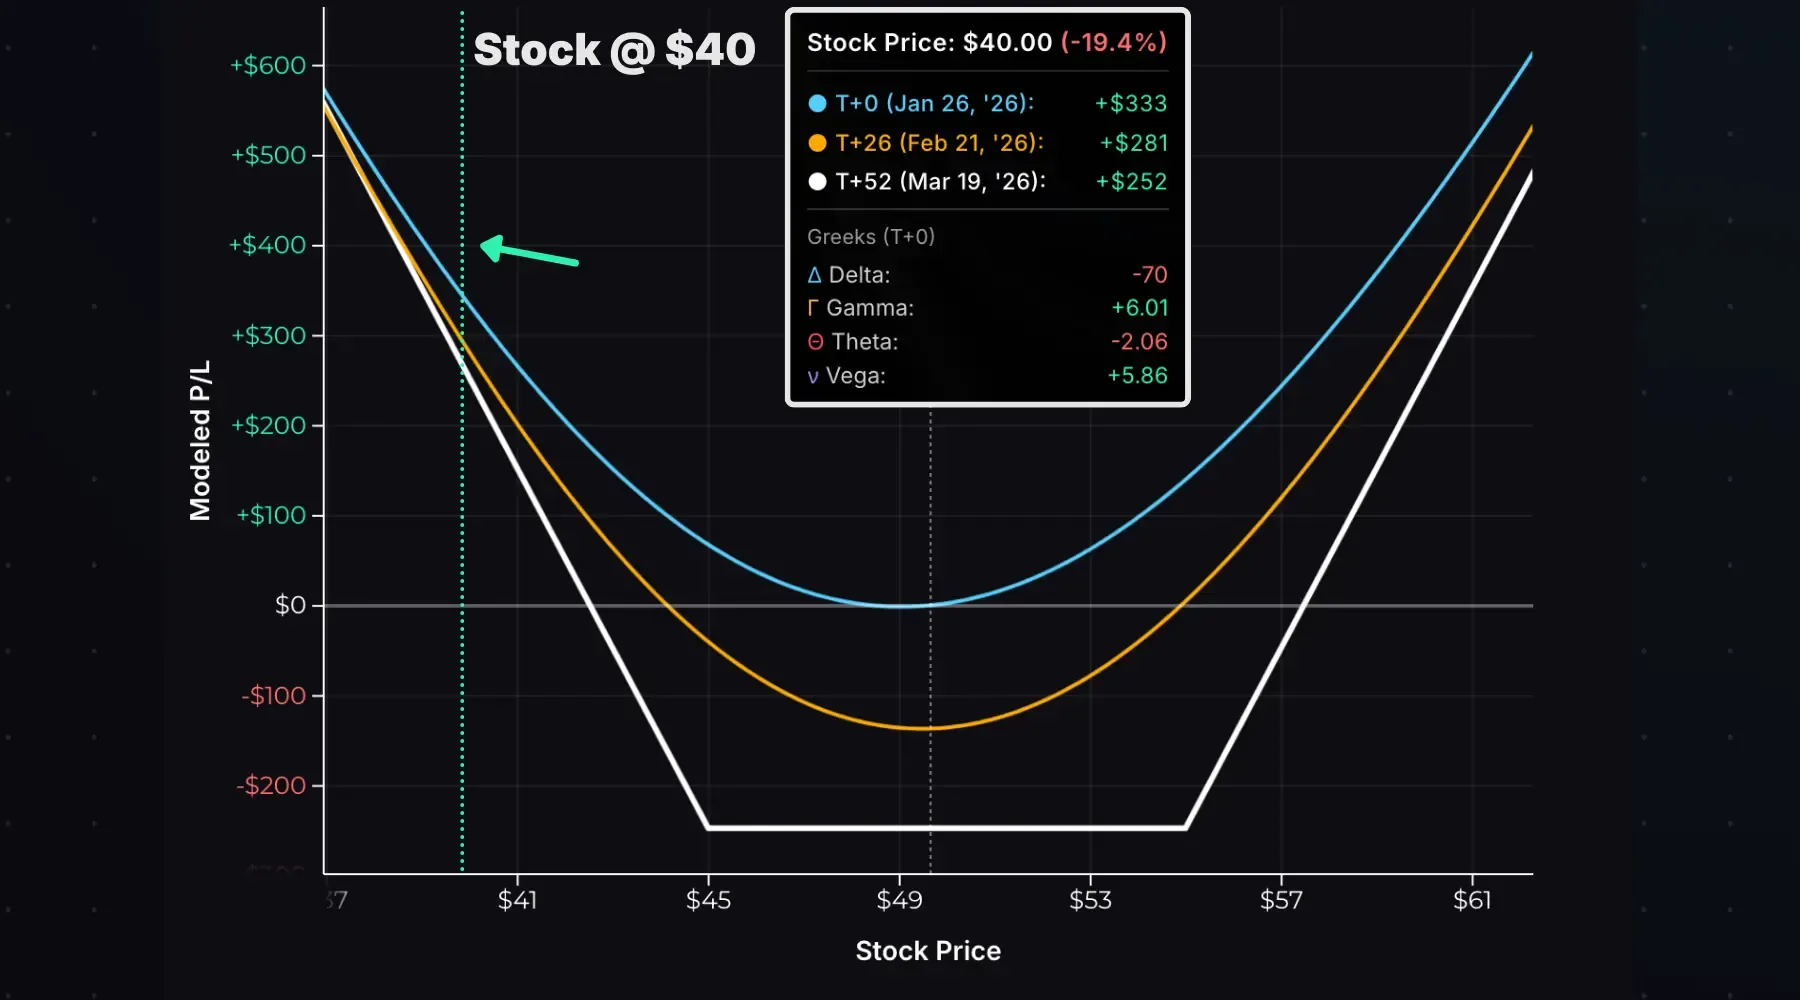
Now consider a rally to $60:
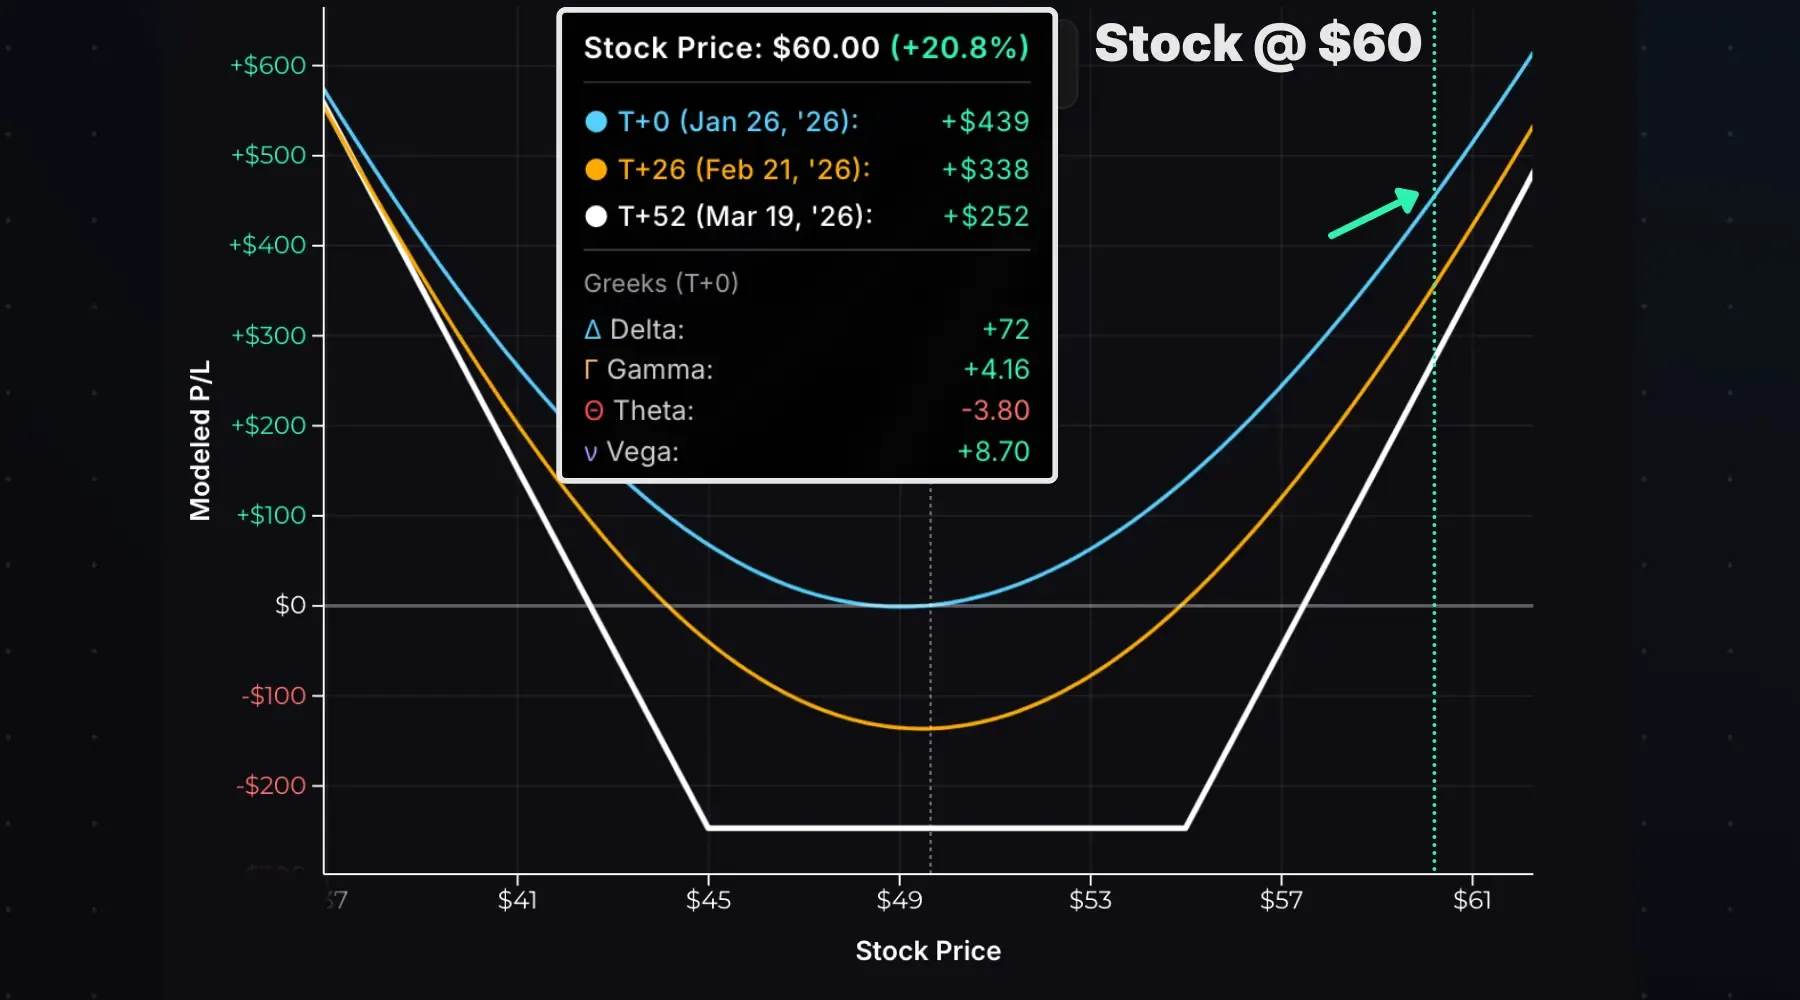
If the stock moves sharply in either direction, delta shifts in your favor. A drop to $40 pushes delta to -70 with a T+0 profit of +$333; a rally to $60 pushes delta to +72 with a T+0 profit of +$439. The position accelerates into profitability as the move continues.
This is positive gamma in action: delta shifts in your favor when the stock moves big in either direction. The maximum delta for a long strangle is either +100 on the upside or -100 on the downside, and the position behaves like long or short stock.
Time Decay Impact
Time decay is the enemy of a long strangle. As expiration approaches, if the stock stays between the strikes, the strangle loses value, even if the stock moves towards one of the strikes.
The chart below visualizes time decay. The T+0 curve shows P/L at entry. The T+26, T+40, and T+52 curves show modeled P/L at future dates:
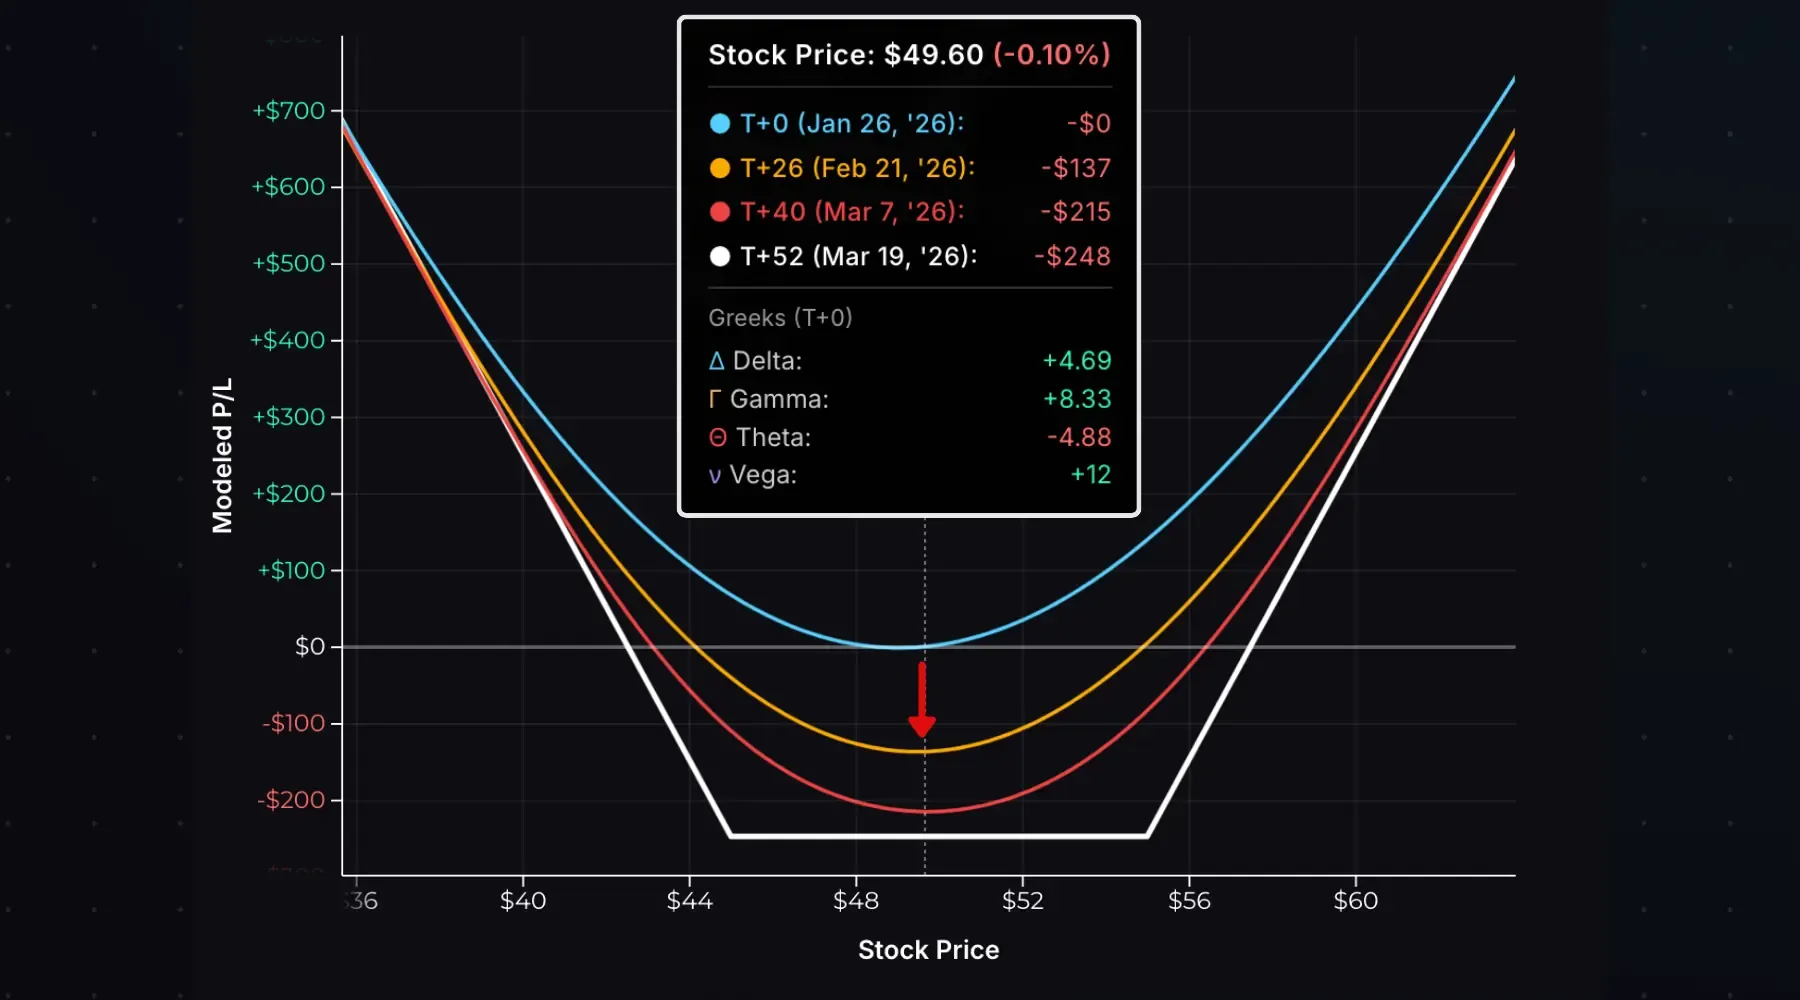
With IBIT at $49.60 (between the strikes), here’s how losses grow over time:
| Time | P/L |
|---|---|
| T+0 (Entry) | $0 |
| T+26 | −$137 |
| T+40 | −$215 |
| T+52 (Expiration) | −$248 (max loss) |
The P/L curves show negative theta in action: losses grow as expiration approaches with the stock between the strikes. You need the stock to move before time decay erodes your position.
OTM Theta Decay Curve
OTM options decay faster than ATM options on a percentage basis. The chart below shows a 45-day 90-strike put on a $100 stock with 30% IV, assuming the stock stays pinned at $100:
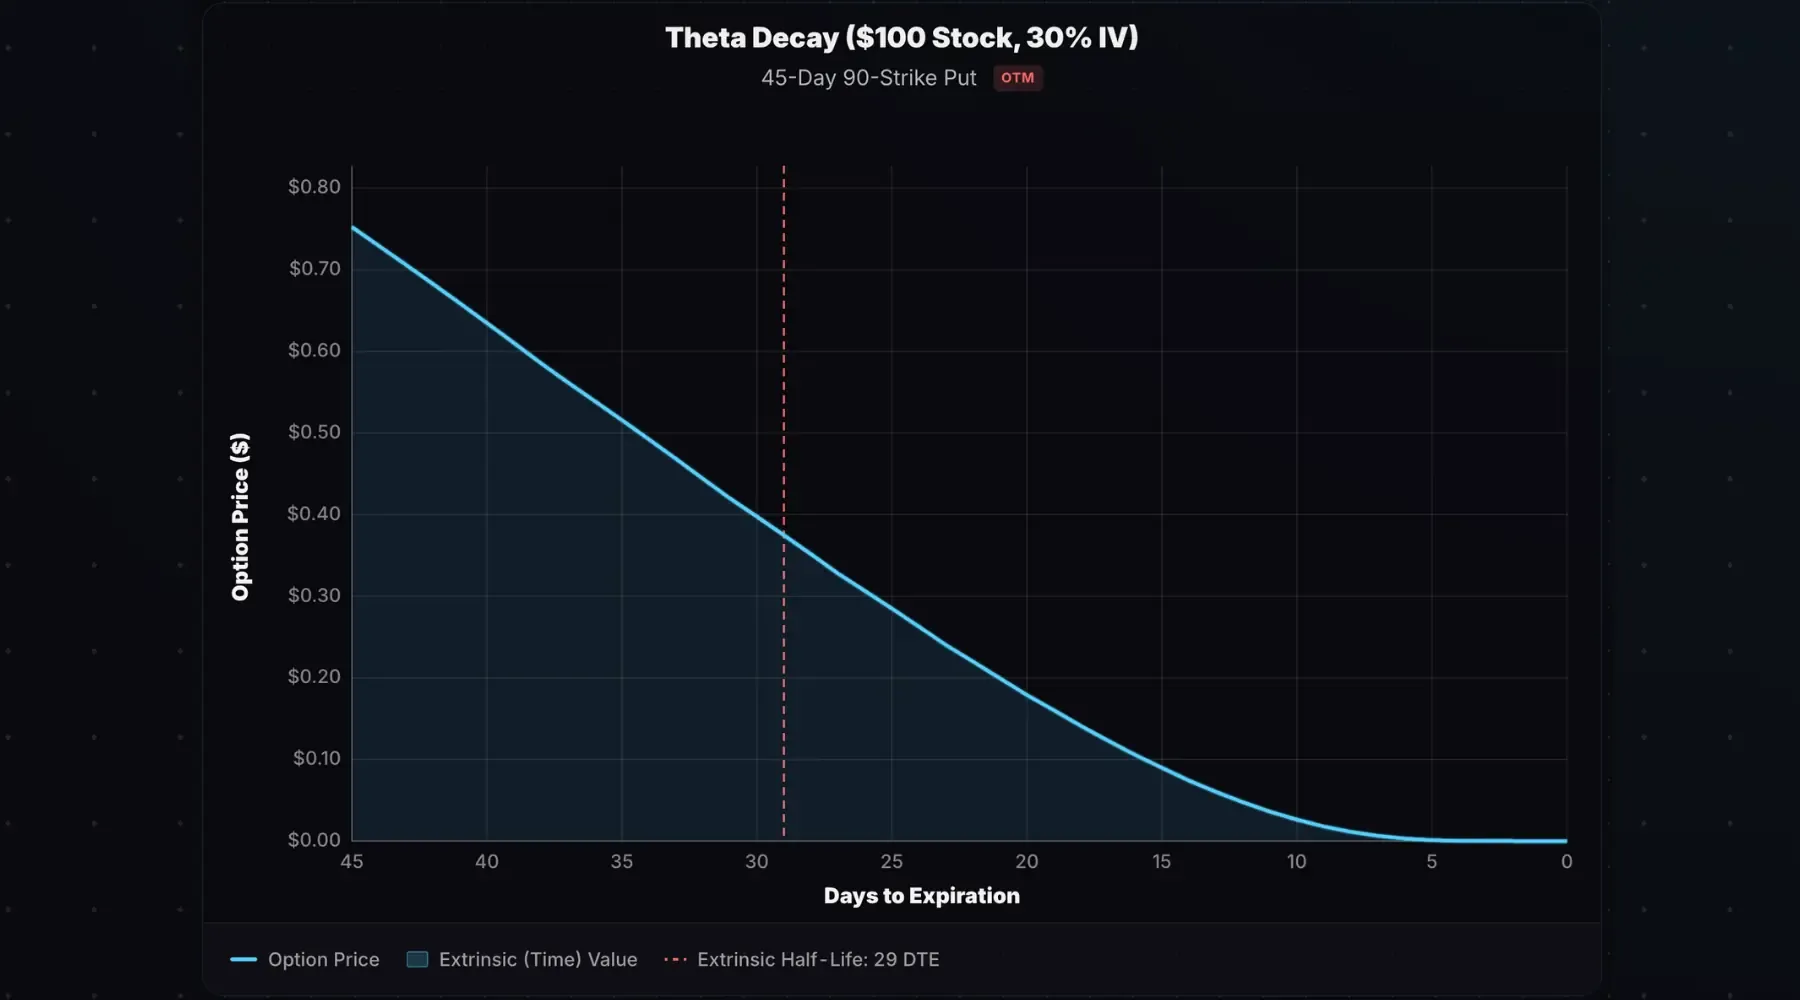
The put loses half its value by 29 DTE, only 16 days into the trade. That’s 36% of the trade duration to lose 50% of the option’s value. OTM options lose a significant portion of their value well before expiration without a favorable move.
This hurts long strangles. Your options bleed value quickly, even with substantial time remaining. If you’re going to be right, you need to be right sooner rather than later.
Implied Volatility Impact
Long strangles are long volatility trades. The position has positive vega: it benefits when implied volatility rises and suffers when IV falls.
The chart below shows the modeled impact of an immediate 10% IV increase on this IBIT strangle:
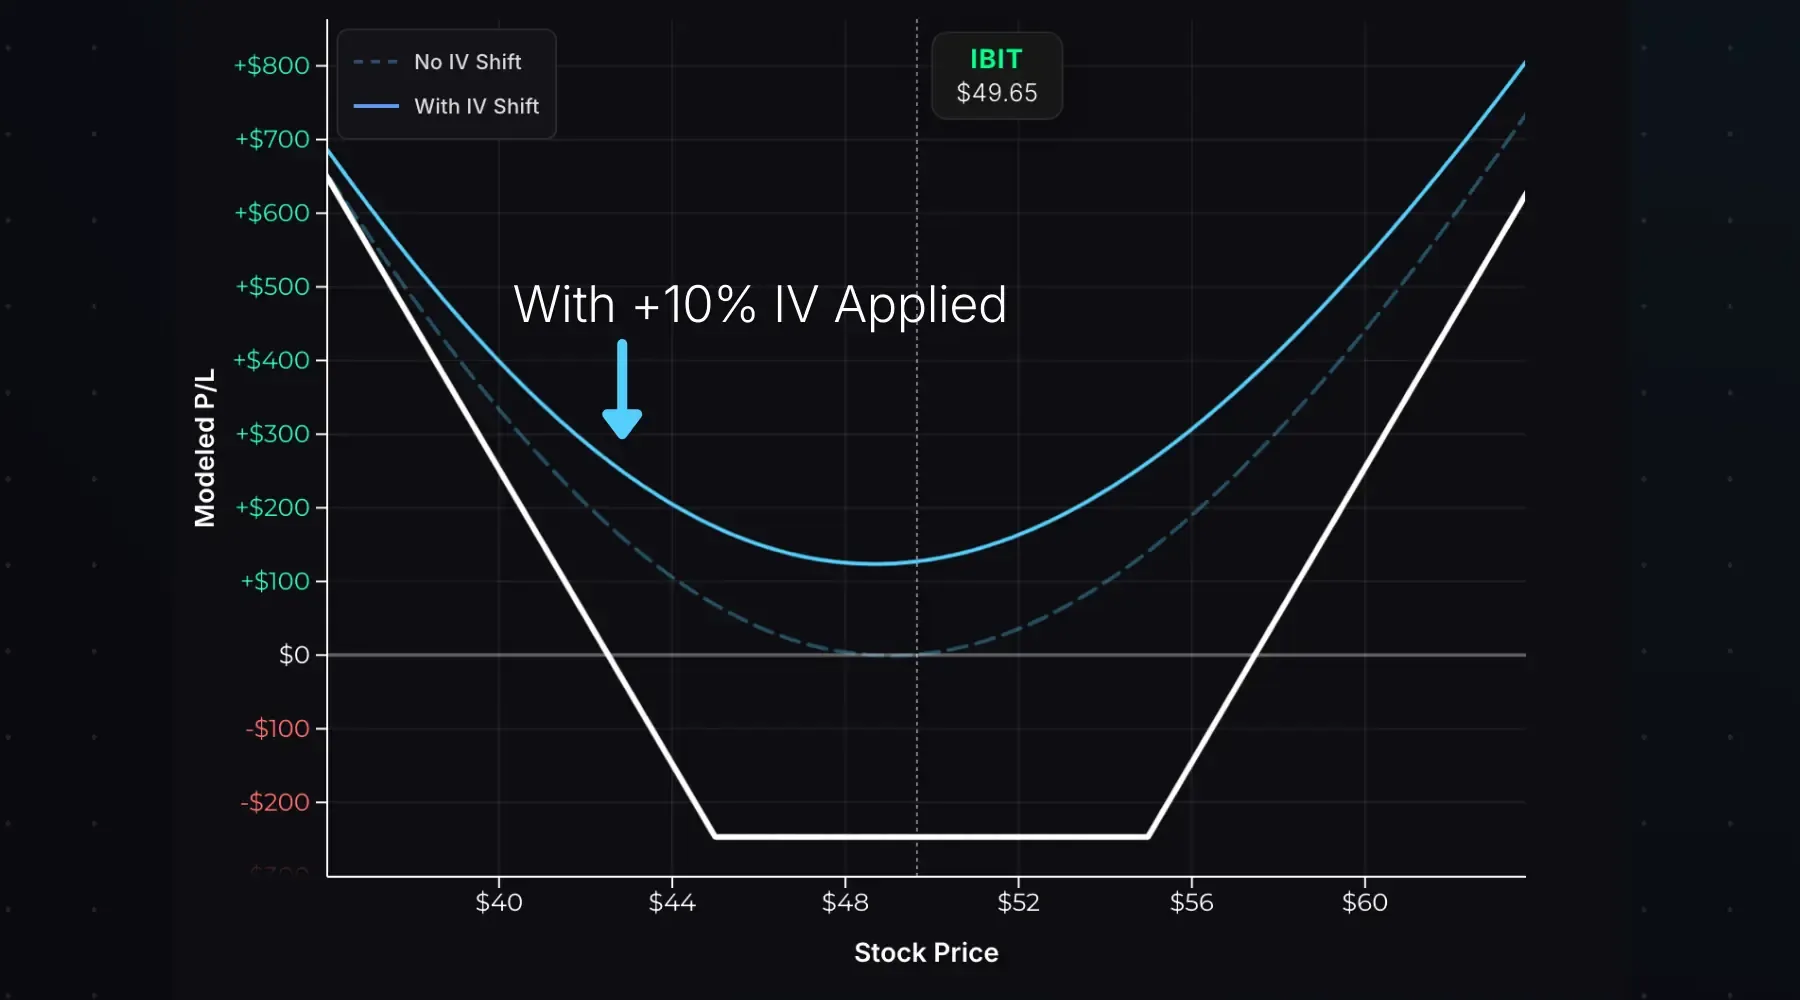
The dashed line is the original T+0 P/L curve at entry. The solid line shows projected P/L with +10% IV applied. The shifted curve is higher across every stock price because the strangle is worth more, since both the call and put prices increased.
How to interpret this: buying a strangle is a bet that a stock’s actual movements will be larger than implied, or that the market will reprice expectations higher. If IV rises after you buy, you profit even if the stock price doesn’t move (assuming not too much time has passed!).
The flip side: if IV drops, you lose money even if the stock hasn’t moved. This is why buying strangles into elevated IV (before earnings, for example) is risky. The IV crush can devastate your position overnight.
Strike Selection
Strike selection determines your cost, breakevens, and probability of profit.
Delta-Based Selection
A common way to select strikes is based on delta. Lower delta = further OTM = cheaper, but requires a bigger move.
| Strike Deltas | Characteristics |
|---|---|
| 30Δ call + 30Δ put | Closer to ATM, higher cost, tighter breakevens |
| 20Δ call + 20Δ put | Moderate cost, moderate breakevens |
| 16Δ call + 16Δ put | ~1 standard deviation, cheaper, wider breakevens |
| 10Δ call + 10Δ put | Far OTM, cheapest, requires the largest move |
Lower delta = cheaper strangle = smaller max loss, but the stock must move further to profit.
Skewing Directionally
You don’t have to buy symmetric strikes. Adjusting the deltas lets you express a directional lean while still profiting from a move in either direction.
Example: Buy a 20-delta put and a 30-delta call.
- Net position delta: positive (bullish lean)
- You profit more from an upside move
- Can still profit if the stock crashes, but need a larger downside move
Entry, Exit, and Expiration
To enter: Buy an OTM call and OTM put at different strikes with the same expiration. You’ll pay a debit.
To exit before expiration: Sell both options in a single order. You’ll receive a credit. Profit = credit received − debit paid.
Potential scenarios at expiration, using a 95/105 strangle bought for $3:
| Stock at Expiration | Result |
|---|---|
| $100 (between strikes) | Both expire worthless. Max loss: $300. |
| $110 (beyond call breakeven) | Call worth $5, put worthless. Profit: $200. |
| $85 (beyond put breakeven) | Put worth $10, call worthless. Profit: $700. |
Buying Strangles Around Earnings
Some traders buy strangles before earnings announcements, betting on a move larger than the market expects. This is a defined-risk way to play earnings, but the odds are against you.
The market prices expected earnings moves into options. The ATM straddle price roughly equals the expected move. To profit buying a strangle, the stock must move more than expected, which is a low-probability event.
With such little time to expiration in weekly earnings trades, and the IV crush that occurs once the earnings data is known, an earnings strangle needs to become intrinsically valuable to gain immunity from the sudden IV collapse after earnings. This means a move well beyond the strangle’s strikes.
Bottom line: Buying strangles through earnings is a low-probability trade. You need an outsized move to overcome the IV crush. If you play earnings, keep position sizes small, as most of these trades lose money.
Long Strangle vs Short Strangle
A short strangle is the opposite of a long strangle: selling an OTM call and put instead of buying them.
| Long Strangle | Short Strangle | |
|---|---|---|
| Entry | Debit | Credit |
| Max Profit | Unlimited | Limited (premium received) |
| Max Loss | Limited (debit paid) | Unlimited |
| Profits When | Stock moves big in either direction | Stock stays between strikes |
| Volatility Exposure | Long (benefits from rising IV) | Short (benefits from falling IV) |
| Theta | Negative (time hurts) | Positive (time helps) |
Long Strangle vs Long Straddle
A straddle buys a call and put at the same strike, typically ATM.
| Long Strangle | Long Straddle | |
|---|---|---|
| Strikes | Different (OTM call, OTM put) | Same (ATM) |
| Cost | Lower | Higher |
| Max Loss | Lower | Higher |
| Breakevens | Further from stock price | Closer to stock price |
| Profit Zone | Requires larger move | Profits from smaller move |
Example: Stock at $100.
- Long strangle for $3: Buy 105 call, buy 95 put → breakevens at $92 and $108
- Long straddle for $7: Buy 100 call, buy 100 put → breakevens at $93 and $107
The straddle has tighter breakevens but costs more. The strangle costs less but requires a bigger move to profit.
Long Strangle vs Long Iron Condor
A long iron condor adds short options outside the long strikes, reducing the cost and tightening breakevens.
| Long Strangle | Long Iron Condor | |
|---|---|---|
| Risk | Limited (debit paid) | Limited (debit paid) |
| Max Profit | Unlimited | Limited (spread width − debit) |
| Cost | Higher | Lower |
| Breakevens | Further out | Closer |
The table assumes the same strikes are used for the long options.
The long iron condor caps your profit potential in exchange for a lower cost and tighter breakevens. It’s a cheaper way to bet on movement, but your upside is limited.
- A long strangle buys an OTM call and OTM put at different strikes with the same expiration, paying a debit.
- Max loss equals the debit paid and occurs if the stock closes between the strikes; max profit is unlimited to the upside.
- Long strangles are positive gamma, positive vega, and negative theta: they profit from large moves and rising IV, but bleed from time decay.
- OTM options decay quickly, so you need the stock to move before theta erodes your position.
- Buying strangles through earnings is low-probability; you need a move larger than the market expects to overcome IV crush.
Related Guides
- What Is a Short Strangle?: Sell a strangle instead of buying it. Collect premium and profit from little movement.
- What Is a Long Straddle?: Same concept, but buy ATM options.
- What Is Theta?: Understanding time decay
- What Is Gamma?: Why stock movements help long premium trades
- What Is Vega?: How volatility affects option prices
- What Is Implied Volatility?: The key input driving strangle prices
Ready to model your own strangles? Use our Strangle Calculator to visualize P/L for any long strangle position.