What Is a Short Straddle?
Short straddle options strategy explained visually: payoff diagrams, Greeks tables, and examples showing how the strategy works.
What Is a Short Straddle?
A short straddle combines selling a naked call and naked put at the same strike price, typically at-the-money (ATM). Both options share the same expiration date. You receive a credit equal to the call premium plus the put premium. Selling straddles is a market-neutral strategy that profits when the stock price remains in a tight range.
Short Straddle Example
If a stock is at $100, a short straddle would be:
- Sell one 100 call for $5.00
- Sell one 100 put for $5.00
- Total Credit: $10.00
The straddle makes money as long as the stock stays between $90 and $110 as time passes. As the options decay, the straddle price falls, letting you buy it back cheaper. Maximum profit occurs if the stock is exactly at $100 at expiration.
Payoff Diagram
The short straddle payoff forms an inverted V: max profit at the strike, sloping downward in either direction:
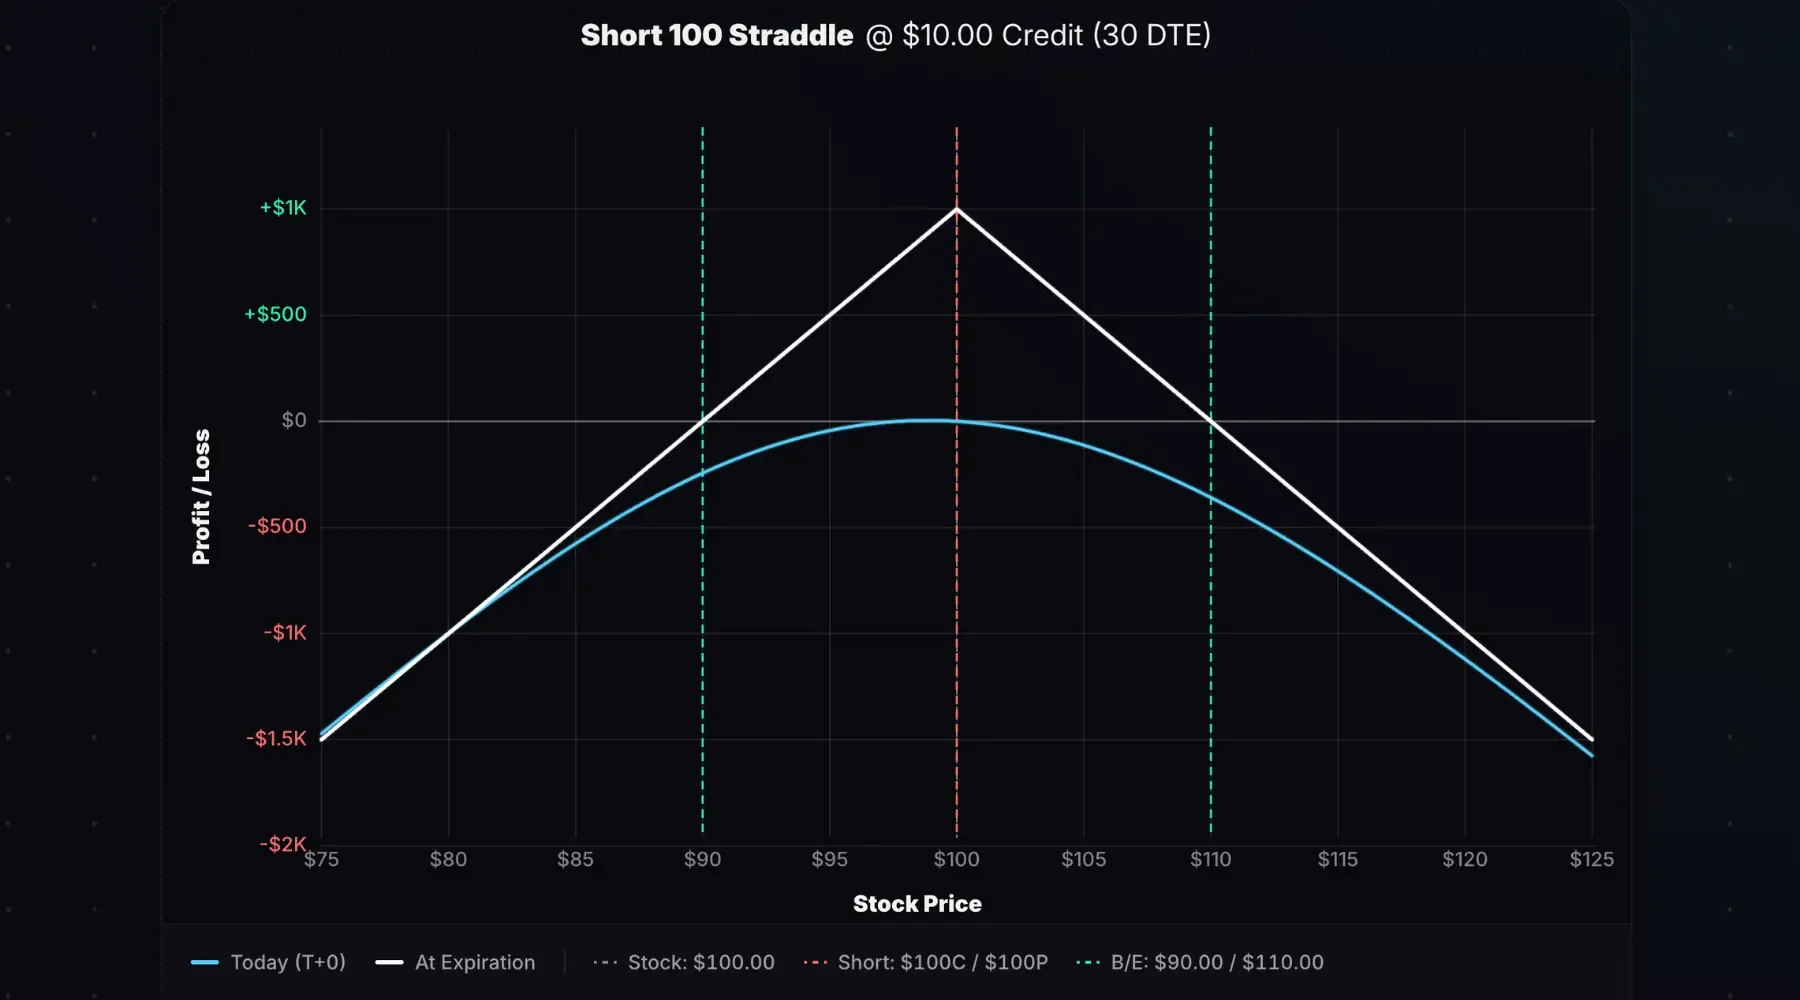
Stock at Entry: $100. Trade: Short 100 straddle entered for a $10.00 credit. 30 days to expiration (DTE).
The white line shows the payoff at expiration. The maximum profit of $1,000 occurs if the stock pins the $100 strike at expiration. Profits shrink as the stock moves away from the short strike in either direction, with unlimited risk to the upside, and substantial risk to the downside (the stock can only fall to zero).
The cyan line (T+0) shows the modeled payoff at entry.
The gap between the two represents time decay yet to be captured.
Key Characteristics
- Max Profit: Total credit × 100. Occurs if the stock closes exactly at the strike price at expiration.
- Max Loss: Unlimited to the upside. To the downside, loss is capped at (strike price − total credit) × 100 (stock falls to zero).
- Upper Breakeven: Strike price + total credit
- Lower Breakeven: Strike price − total credit
- Outlook: Neutral, expecting minimal price movement
Here are the metrics for a 100 straddle sold for $10.00 credit:
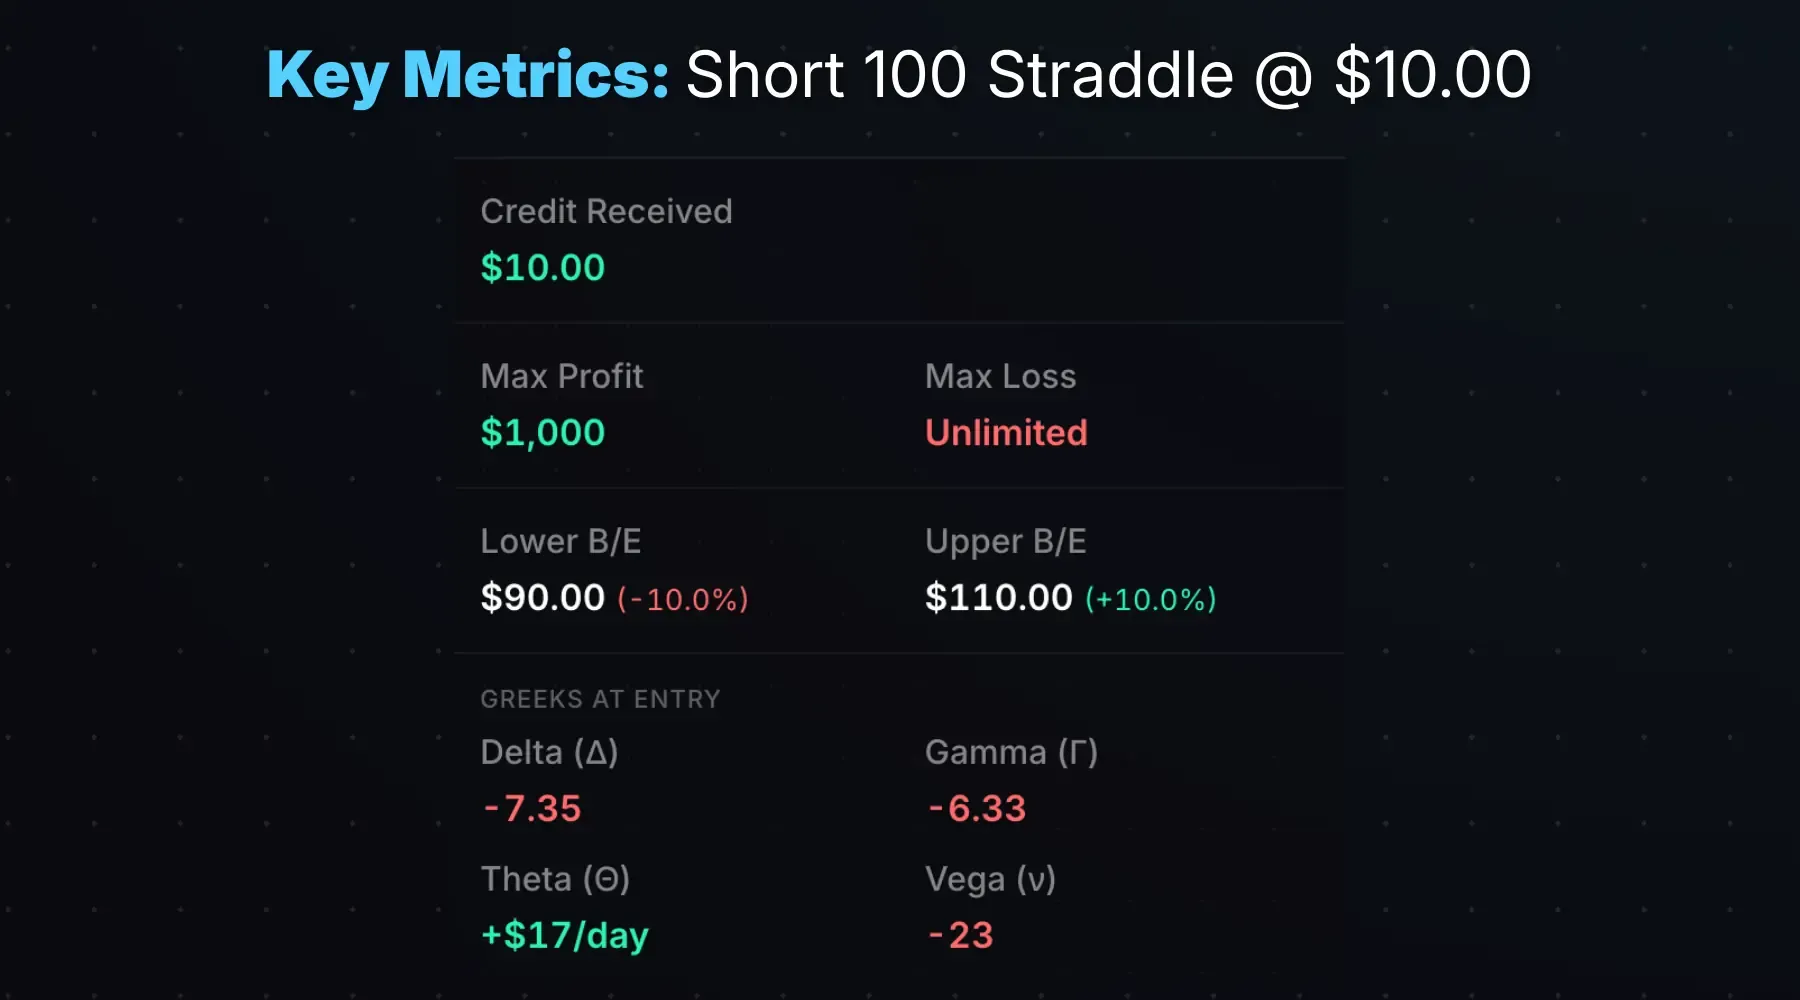
The stock doesn’t need to pin the strike to be profitable; any close between $90 and $110 results in a profit at expiration.
Since the stock closing exactly at $100 at expiration is near-zero probability, don’t expect to achieve max profit on a short straddle. More realistic profit targets are 25-50% of the max profit. Undefined risk also means significant margin requirements, often multiples of the credit received.
How the Greeks Affect a Short Straddle
A short straddle has straightforward Greek exposures: negative gamma, negative vega, positive theta. Delta begins near zero for ATM straddles, making the trade market-neutral at entry.
| Greek | Exposure | What It Means |
|---|---|---|
| Delta (Δ) | Near Zero | Neutral at entry; shifts as the stock moves |
| Gamma (Γ) | Negative | Delta shifts against you as the stock moves |
| Theta (Θ) | Positive | Time decay benefits the position |
| Vega (ν) | Negative | Rising IV hurts; falling IV helps |
Here’s a 187.5 short straddle on NVDA entered for a $15.00 credit with 26 DTE. The margin requirement to open this trade was approximately $6,000, or 4x the credit received. If the stock moves away from the strike, margin can increase further.
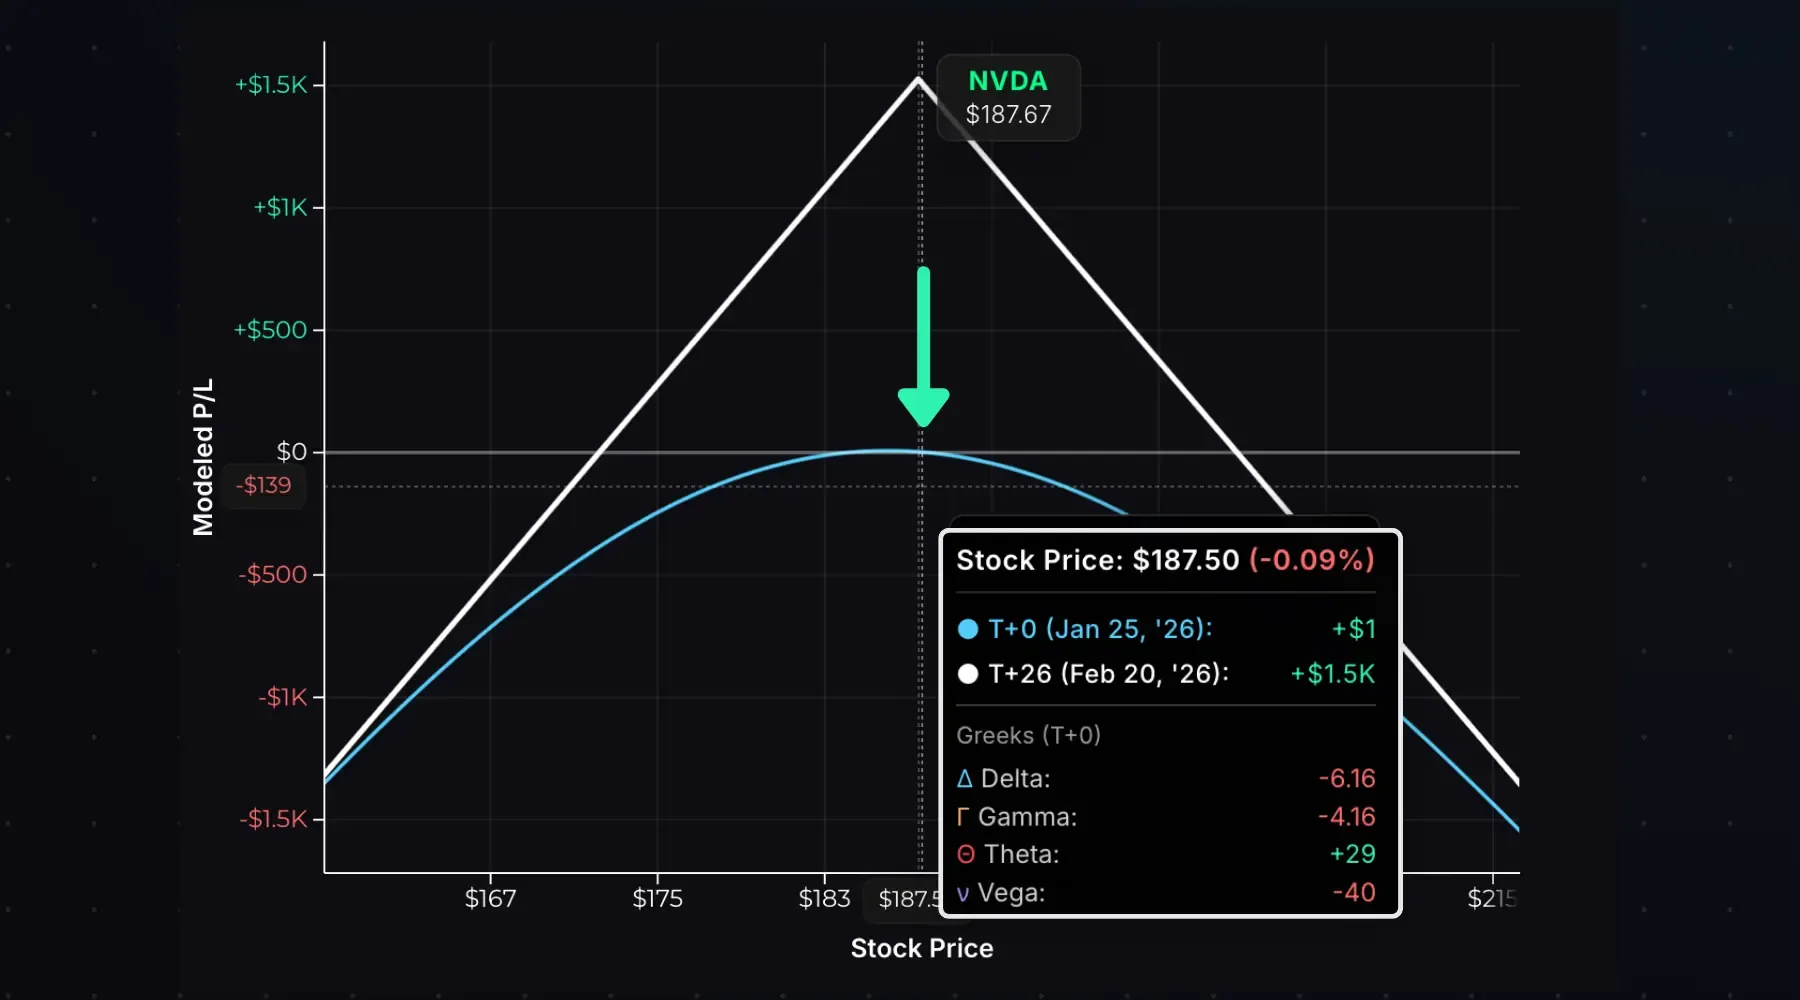
At entry, delta is -6.16, relatively flat compared to the maximum position delta range of -100 to +100. The T+0 P/L line shows low sensitivity to small stock price changes around the entry stock price.
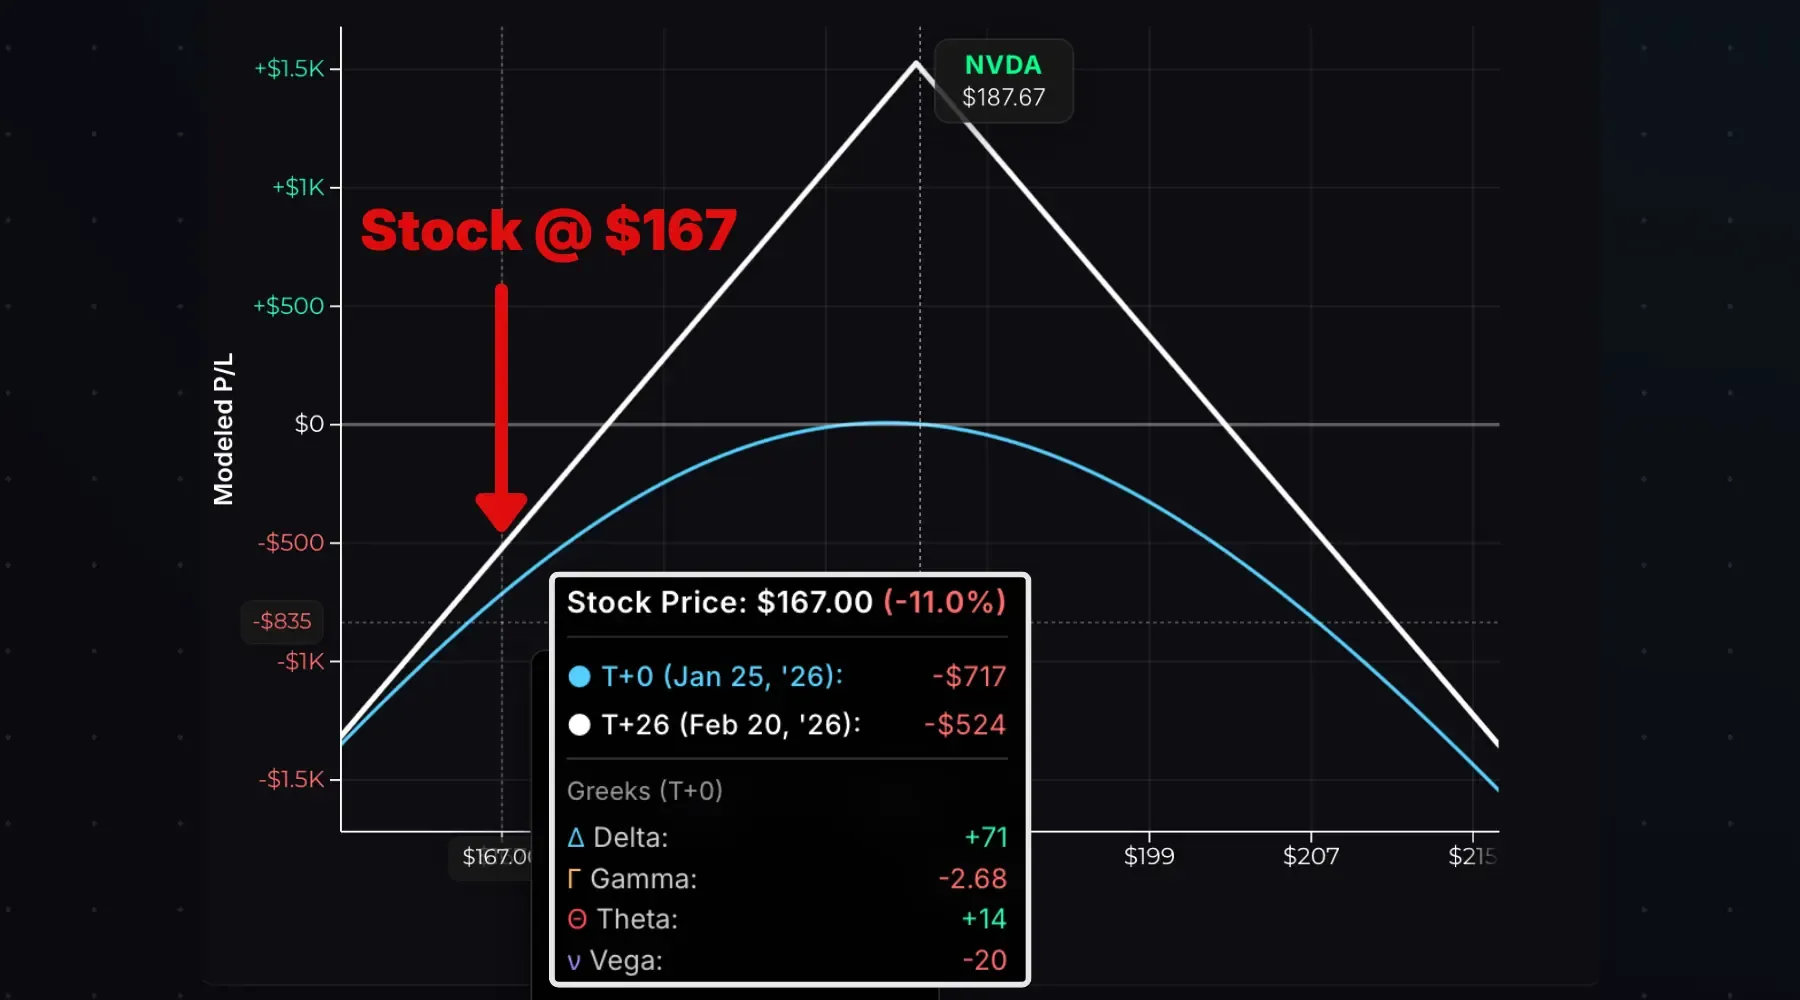
But if the stock moves in either direction, delta shifts against you. Consider an immediate drop to $167:
Now consider a rally to $206:
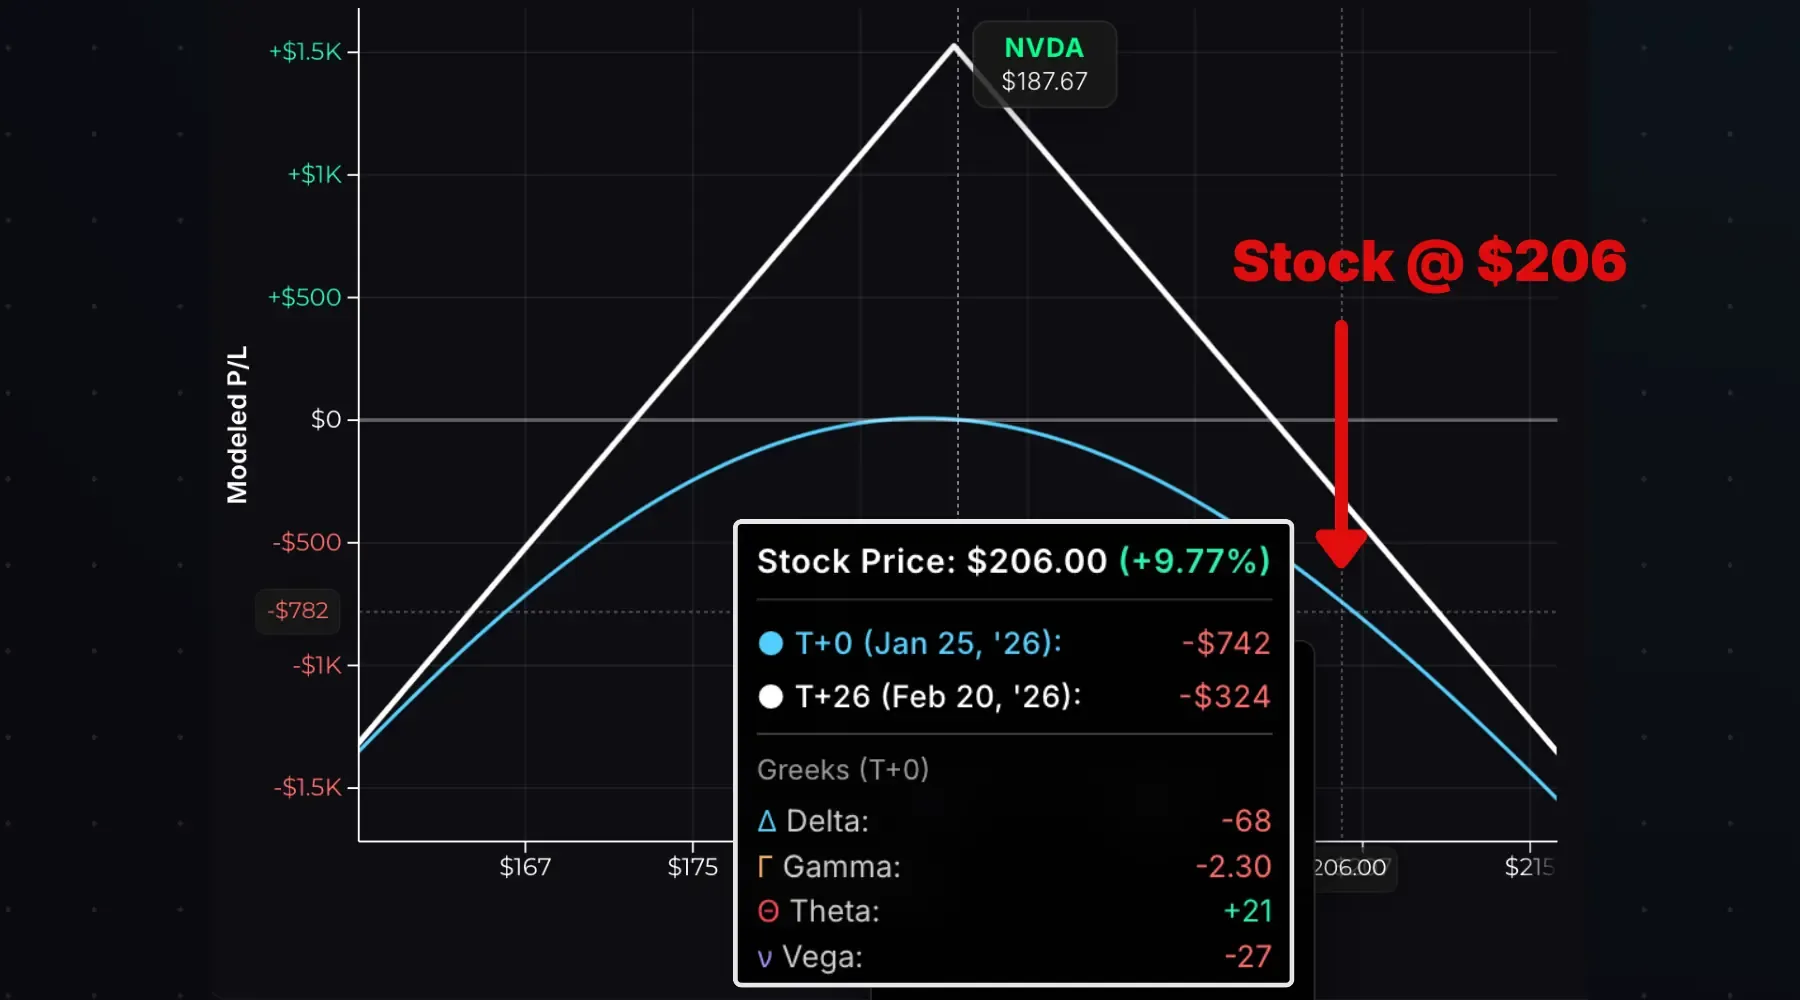
If the stock moves sharply in either direction, delta shifts against you. A drop to $167 pushes delta to +71; a rally to $206 pushes it to -68. In both cases, losses accelerate as the stock continues moving, until delta maxes out at ±100 and the straddle behaves like a pure stock position.
This is negative gamma in action: delta shifts against you when the stock moves away from the short strike.
Gamma Risk vs DTE
ATM gamma increases as expiration approaches, causing larger P/L swings for the same stock movement. This is “gamma risk.”
The chart below shows gamma for a 150-strike call at 30, 5, and 1 DTE:
Near expiration, stock movements around the strike cause much larger P/L swings. This cuts both ways: favorable if the stock moves toward your strike, but punishing if it moves away.
Time Decay Impact
Time decay is the primary profit engine for a short straddle. Both the short call and short put have positive theta, and ATM options have the highest extrinsic value, meaning they have the most to lose as time passes.
As expiration approaches, extrinsic value evaporates from both legs. If the stock stays near the strike, the straddle’s value drops and profits grow because you can buy it back cheaper.
The chart below visualizes time decay. The T+0 curve shows P/L at entry. The T+13, T+20, and T+26 curves show modeled P/L at future dates:
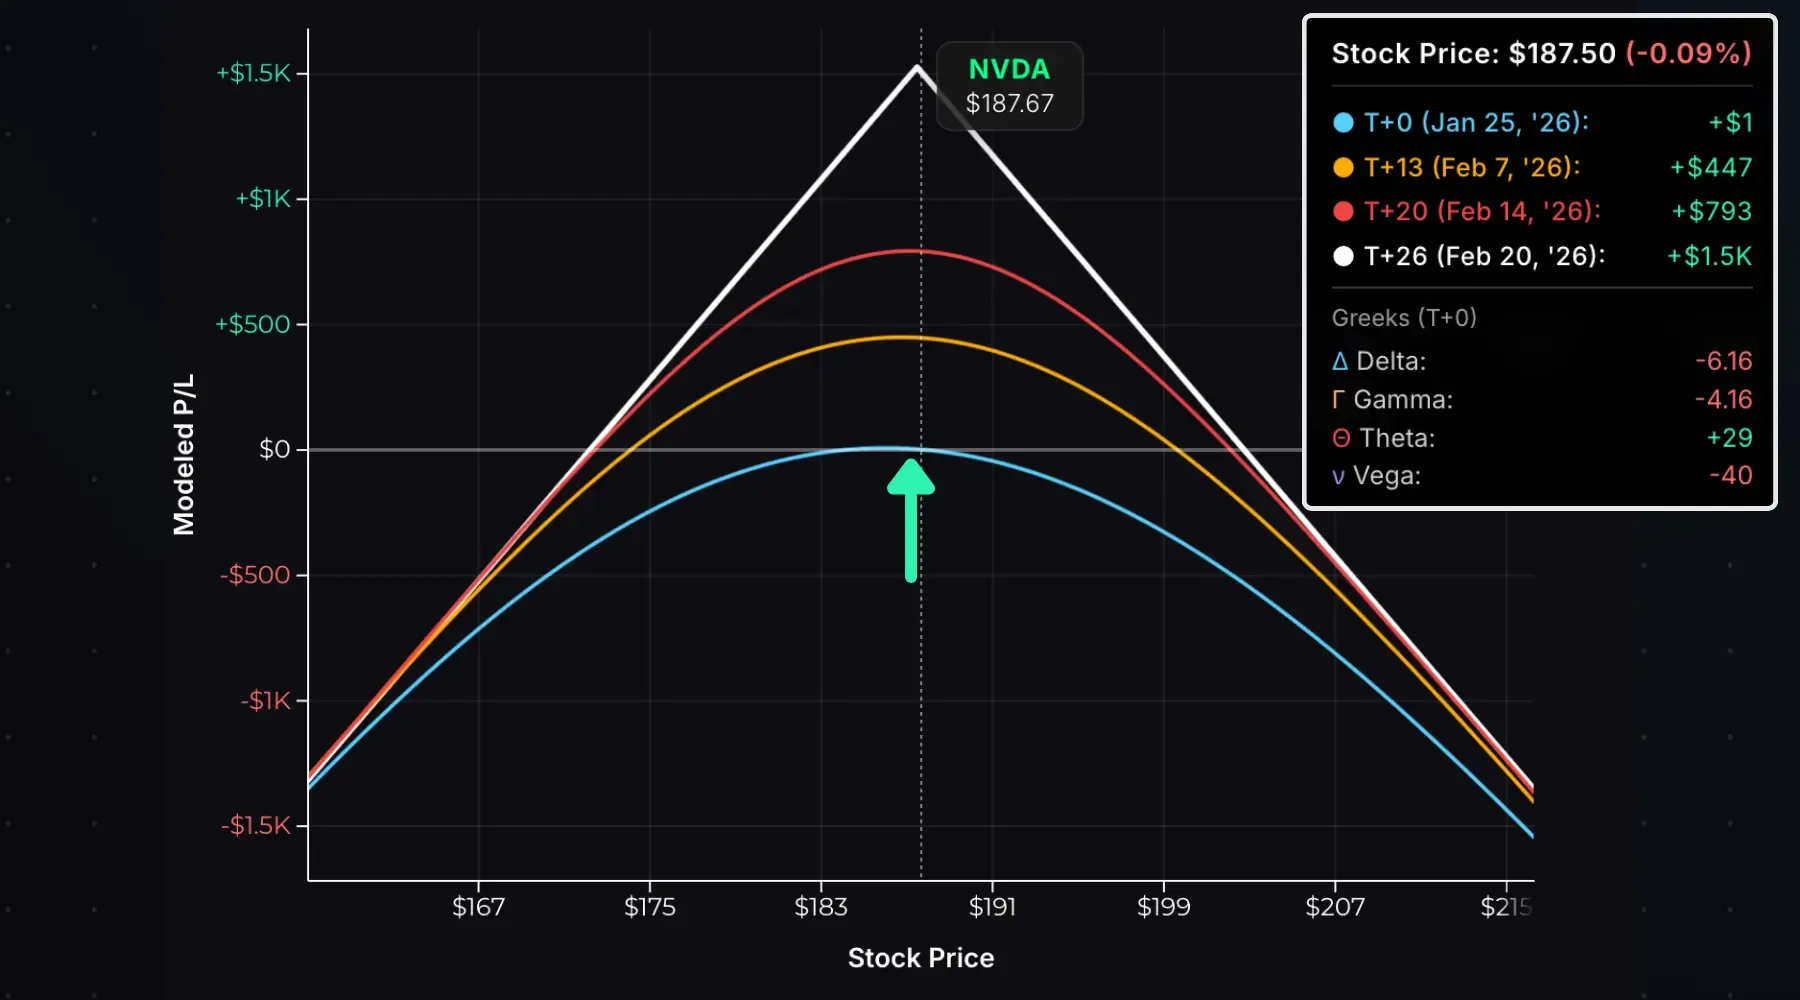
With the stock at the short strike ($187.50), here’s how the straddle price and P/L evolve:
| Time | Straddle Price | P/L |
|---|---|---|
| T+0 (Entry) | $15.00 | $0 |
| T+13 | $10.53 | +$447 |
| T+20 | $7.07 | +$793 |
| T+26 (Expiration) | $0.00 | +$1,500 |
As the straddle price falls, profits grow since you can buy it back cheaper than you sold it.
ATM Theta Decay Curve
ATM options don’t decay linearly. Theta is slow early and accelerates near expiration. The chart below visualizes the decay of a 30-day 250 call option assuming the stock stays pinned at $250 over time:
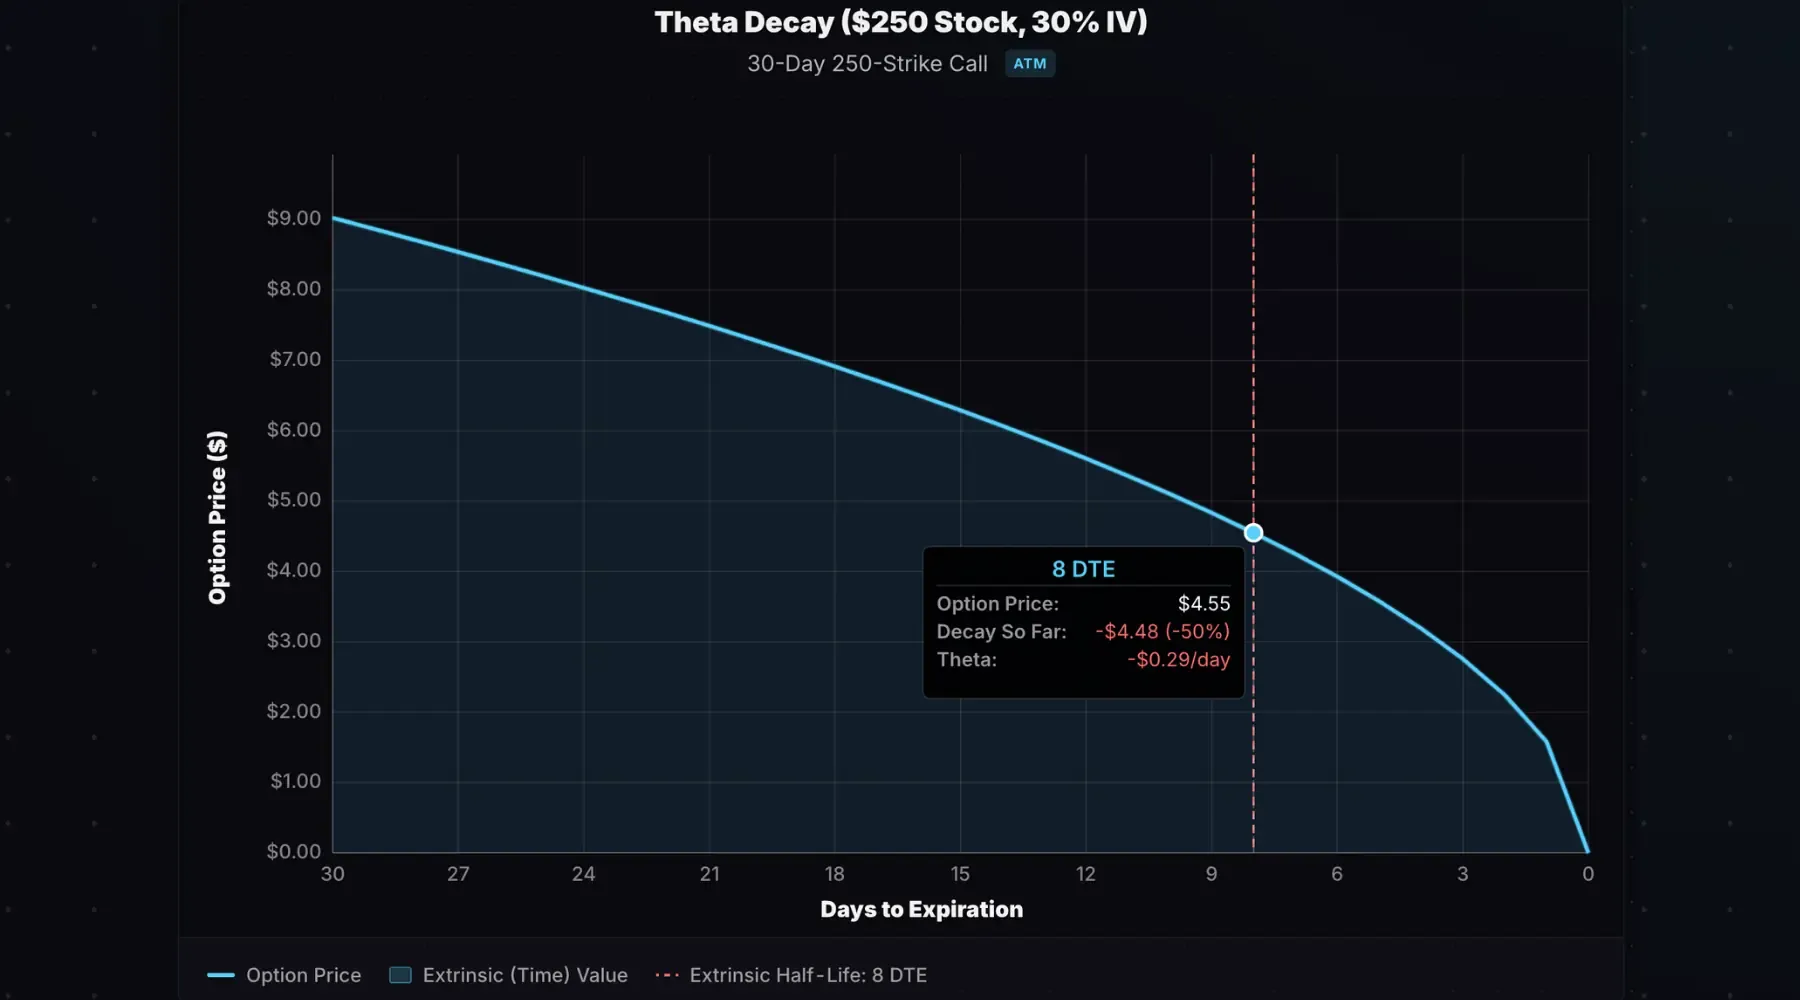
The call loses 50% of its value by 8 DTE. Our theta decay curve calculator shows “73% elapsed,” meaning this option loses half its value after 73% of the trade duration has passed. Decay is slower in the first half of the trade, and faster in the second.
This matters for straddles because you’re selling ATM options on both sides. If the stock stays near the strike in the first few days, your position won’t show significant profits yet. To capture 50%+ of max profit, the stock needs to be near the strike later in the trade, closer to expiration, when theta accelerates.
Implied Volatility Impact
Short straddles are short volatility trades. The position has negative vega: it benefits when implied volatility falls and suffers when IV rises.
The chart below shows the modeled impact of an immediate 10% IV increase on this NVDA straddle:
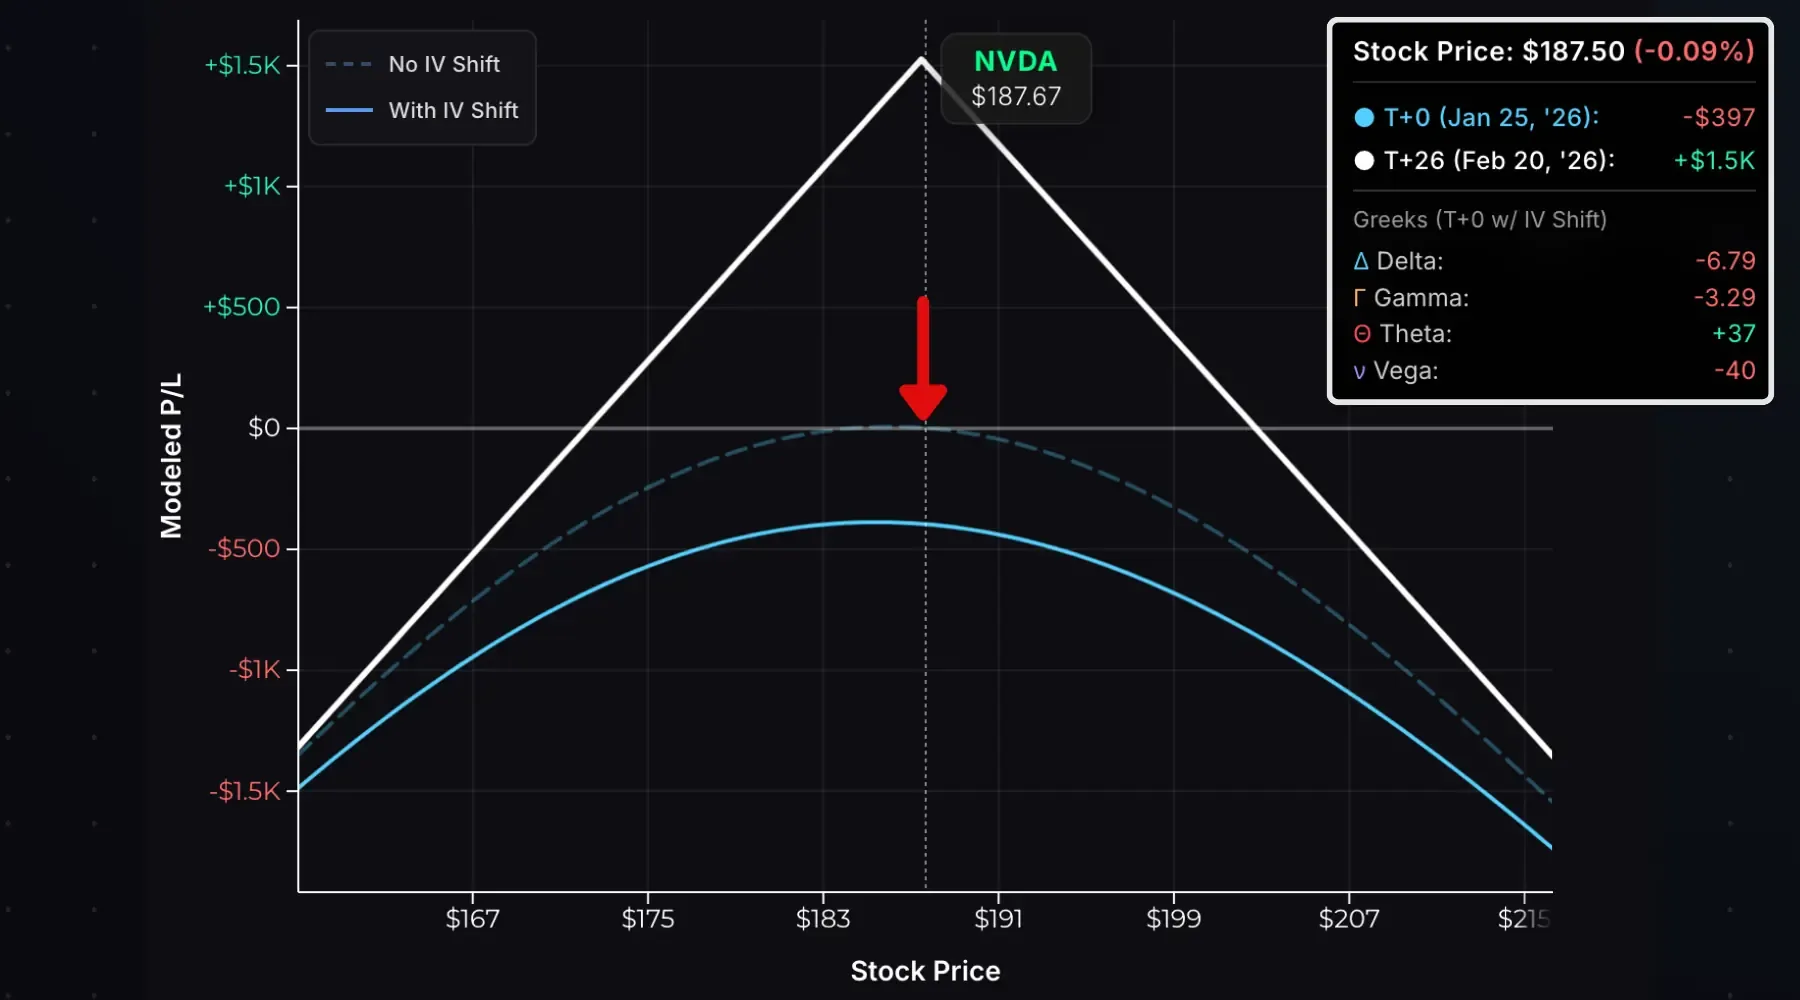
The dashed line is the original P/L curve at entry. The solid line shows P/L with +10% IV applied. The position loses $397 from the IV spike alone.
Here’s the math. Using a 187.67 stock price, 187.5 strike, 26 DTE, 5% risk-free rate, and 0% dividend yield:
| IV | Call Price | Put Price | Straddle Price |
|---|---|---|---|
| 40% | $8.30 | $7.64 | $15.94 |
| 50% | $10.29 | $9.62 | $19.91 |
Calculated using our Options Pricing Calculator
If you sold the straddle at 40% IV and IV immediately spiked to 50%, the straddle price jumps from $15.94 to $19.91, an unrealized loss of $397.
A straddle’s price reflects the market’s expected move. Selling one is a bet that actual movement will be smaller. If the market prices in a larger expected move, the straddle rises and you’re underwater.
Entry, Exit, and Expiration
To enter: Sell an ATM call and ATM put at the same strike and expiration. You’ll receive a credit.
To exit before expiration: Buy back both options in a single order. You’ll pay a debit to close. Profit = credit received − debit paid.
Potential scenarios at expiration, using a 100 straddle sold for $10:
| Stock at Expiration | Result |
|---|---|
| $100 (at strike) | Both expire worthless. Keep $1,000 credit. |
| $105 (within breakeven) | Call $5 ITM, assigned -100 shares at $100. Net profit: $500. |
| $120 (beyond breakeven) | Call $20 ITM. Net loss: $1,000. |
| $70 (beyond breakeven) | Put $30 ITM. Net loss: $2,000. |
Selling Straddles Around Earnings
Some traders sell straddles before earnings announcements to capture the IV crush. This is high-risk.
Earnings reports are catalysts for large moves in either direction. Options in the “earnings expiration cycle” (the nearest expiration after the announcement) trade at elevated IV to reflect this uncertainty.
Example: NVDA November 2025 Earnings
NVDA reported earnings after the close on Wednesday, November 19th, 2025. The weekly options expiring Friday, November 21st, were trading around 122% IV.
| Nov 19 Close (Pre-Earnings) | Nov 20 Open (Post-Earnings) | |
|---|---|---|
| Stock Price | $186.52 | $195.95 |
| 185 Call | $7.65 | $11.40 |
| 185 Put | $5.80 | $0.63 |
| Straddle Price | $13.45 | $12.03 |
| IV | 122% | 93% |
NVDA gapped up $9.43 overnight. Despite the move, the straddle price fell from $13.45 to $12.03. IV collapsed from 122% to 93%. This is the “IV crush.”
This short straddle produced a small overnight win, but carried immense risk. Had NVDA moved $25 instead of $9, the straddle price would have doubled and the trader would have lost 100% relative to the premium received.
The ATM straddle price before earnings roughly equals the market’s expected move. A “2x expected move” means the stock moved twice the straddle price. While uncommon, stocks occasionally move 2-3x the expected move, devastating naked options sellers.
Bottom line: Never short naked options through earnings. Define your risk by buying protective wings (iron condors or iron butterflies instead of straddles or strangles).
Early Assignment
Both legs of a short straddle carry early assignment risk. Since they share the same strike, one leg is almost always ITM.
Short Call Assignment: You sell (short) 100 shares at the strike price. Most likely when the call is deep ITM with little extrinsic value, or on the day before ex-dividend if its extrinsic value is less than the dividend.
Short Put Assignment: You buy 100 shares at the strike price. Most likely when the put is deep ITM with little extrinsic value near expiration.
Early assignment is unlikely unless one leg is deep ITM. ATM options hold significant extrinsic value until the final days before expiration. If your short call or put is only slightly ITM with 5+ days to expiration, early assignment is unlikely.
If one leg is assigned early, you’ll have a stock position plus the remaining short option:
| Assigned Leg | Resulting Position |
|---|---|
| Short Put | Long 100 shares + short call = Covered Call |
| Short Call | Short 100 shares + short put = Covered Put |
Monitor extrinsic value in the ITM leg. If it approaches zero, assignment risk is elevated. Assignment can also trigger a margin call if your account lacks sufficient equity for the stock position.
Short Straddle vs Long Straddle
A long straddle is the opposite position: buying an ATM call and put instead of selling them.
| Short Straddle | Long Straddle | |
|---|---|---|
| Entry | Credit | Debit |
| Max Profit | Limited (premium received) | Unlimited |
| Max Loss | Unlimited | Limited (premium paid) |
| Profits When | Stock stays near strike | Stock moves significantly |
| Volatility Exposure | Short (benefits from falling IV) | Long (benefits from rising IV) |
| Theta | Positive (time helps) | Negative (time hurts) |
Short Straddle vs Short Strangle
A short strangle also sells a call and put, but at different strikes, typically OTM on both sides.
| Short Straddle | Short Strangle | |
|---|---|---|
| Strikes | Same (ATM) | Different (OTM call, OTM put) |
| Premium Collected | Higher | Lower |
| Profit Zone | Narrower | Wider |
| Max Profit | Higher | Lower |
| Breakevens | Closer to stock price | Further from stock price |
Example: Stock at $100.
- Short straddle: Sell 100 call, sell 100 put → breakevens at $90 and $110
- Short strangle: Sell 105 call, sell 95 put → breakevens at $88 and $112
The strangle gives more room for the stock to move, but collects less premium. On a percentage basis, OTM options decay faster than ATM options, so a strangle reaches 50% profit sooner, but that 50% is on a smaller credit. Model both with our Strangle Calculator.
Short Straddle vs Short Iron Butterfly
A short iron butterfly is a short straddle with protective wings, buying an OTM call and put to limit risk.
| Short Straddle | Short Iron Butterfly | |
|---|---|---|
| Risk | Unlimited | Defined |
| Max Profit | Higher | Lower (long options reduce credit) |
| Max Loss | Unlimited | Limited (wing width − credit) |
| Margin Requirement | High | Lower |
Example: Stock at $100.
- Short straddle: Sell 100 call, sell 100 put
- Short iron butterfly: Sell 100 call, sell 100 put, buy 110 call, buy 90 put
The iron butterfly sacrifices profit potential for defined risk. If you want straddle-like exposure with limited downside, use the iron butterfly. Model it with our Iron Butterfly Calculator.
- A short straddle sells an ATM call and ATM put at the same strike and expiration, collecting a credit.
- Max profit equals the total premium received; max loss is unlimited to the upside and substantial on the downside.
- Short straddles are negative gamma, negative vega, and positive theta: they profit from time decay and falling IV.
- ATM gamma explodes near expiration, causing large P/L swings as the stock moves away from the strike.
- Never short naked straddles through earnings. Define your risk with protective wings.
Related Guides
- What Is a Long Straddle?: Buy a straddle instead of selling it
- What Is Theta?: Understanding time decay
- What Is Gamma?: Why stock movements hurt short premium trades
- What Is Vega?: How volatility affects option prices
- What Is Implied Volatility?: The key input driving straddle prices
Ready to model your own straddles? Use our Straddle Calculator to visualize P/L for any short straddle position.