What Is a Short Put?
Short put options explained visually: payoff diagrams, Greeks tables, and examples showing how the strategy works.
A short put is the sale of a put option, which profits when the stock stays above the strike price over time. You collect a premium at entry, keeping the full premium if the stock closes at or above the strike at expiration. If the stock falls below the strike, losses grow, and you may be assigned 100 shares at the strike price.
Short puts are the foundation of the cash-secured put strategy, where you set aside enough cash to buy the shares if assigned. Without that cash secured, the position is a “naked” short put, requiring margin and carrying significant risk if the stock drops.
Short Put Example
If a stock is at $100, a short put would be:
- Sell one 95 put for $3.00
- Total Credit: $3.00
The put makes money as long as the stock stays above $92 (strike − premium). The maximum profit of $300 occurs if the stock closes at or above $95 at expiration: the put expires worthless and you keep the entire premium.
Payoff Diagram
At expiration, the short put payoff is flat above the strike and slopes downward below it:
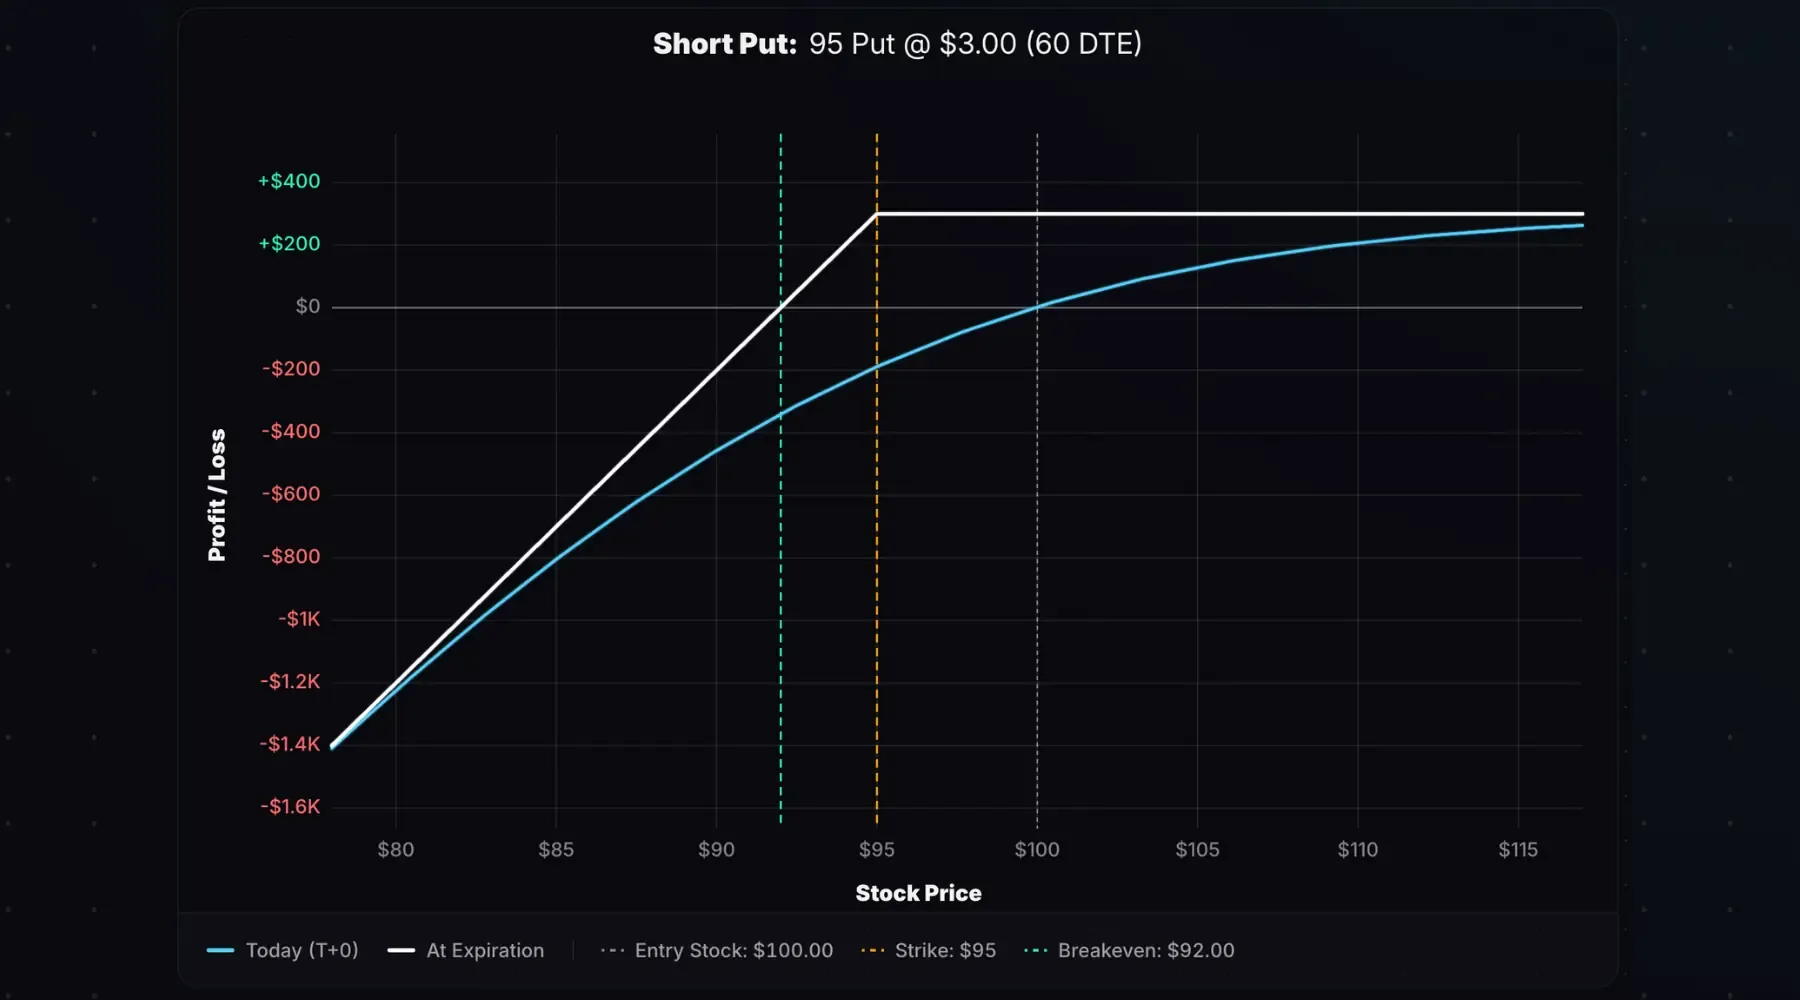
Stock at Entry: $100. Trade: Short 95 put for $3.00 credit. 60 days to expiration (DTE).
The white line shows the payoff at expiration. The maximum profit of $300 occurs if the stock closes at or above the $95 strike price. Below $95, profits shrink until reaching the $92 breakeven. Beyond that, losses grow as the stock falls, with the maximum loss occurring if the stock hits $0.
The cyan line (T+0) shows the modeled payoff at entry. The gap between the two lines represents time decay yet to be captured.
Key Characteristics
- Max Profit: Premium received × 100. Occurs if the stock closes at or above the strike at expiration.
- Max Loss: (Strike − premium) × 100. Occurs if the stock falls to $0.
- Breakeven: Strike price − premium received
- Outlook: Moderately bullish
Here are the metrics for a 95-strike put sold for $3.00:
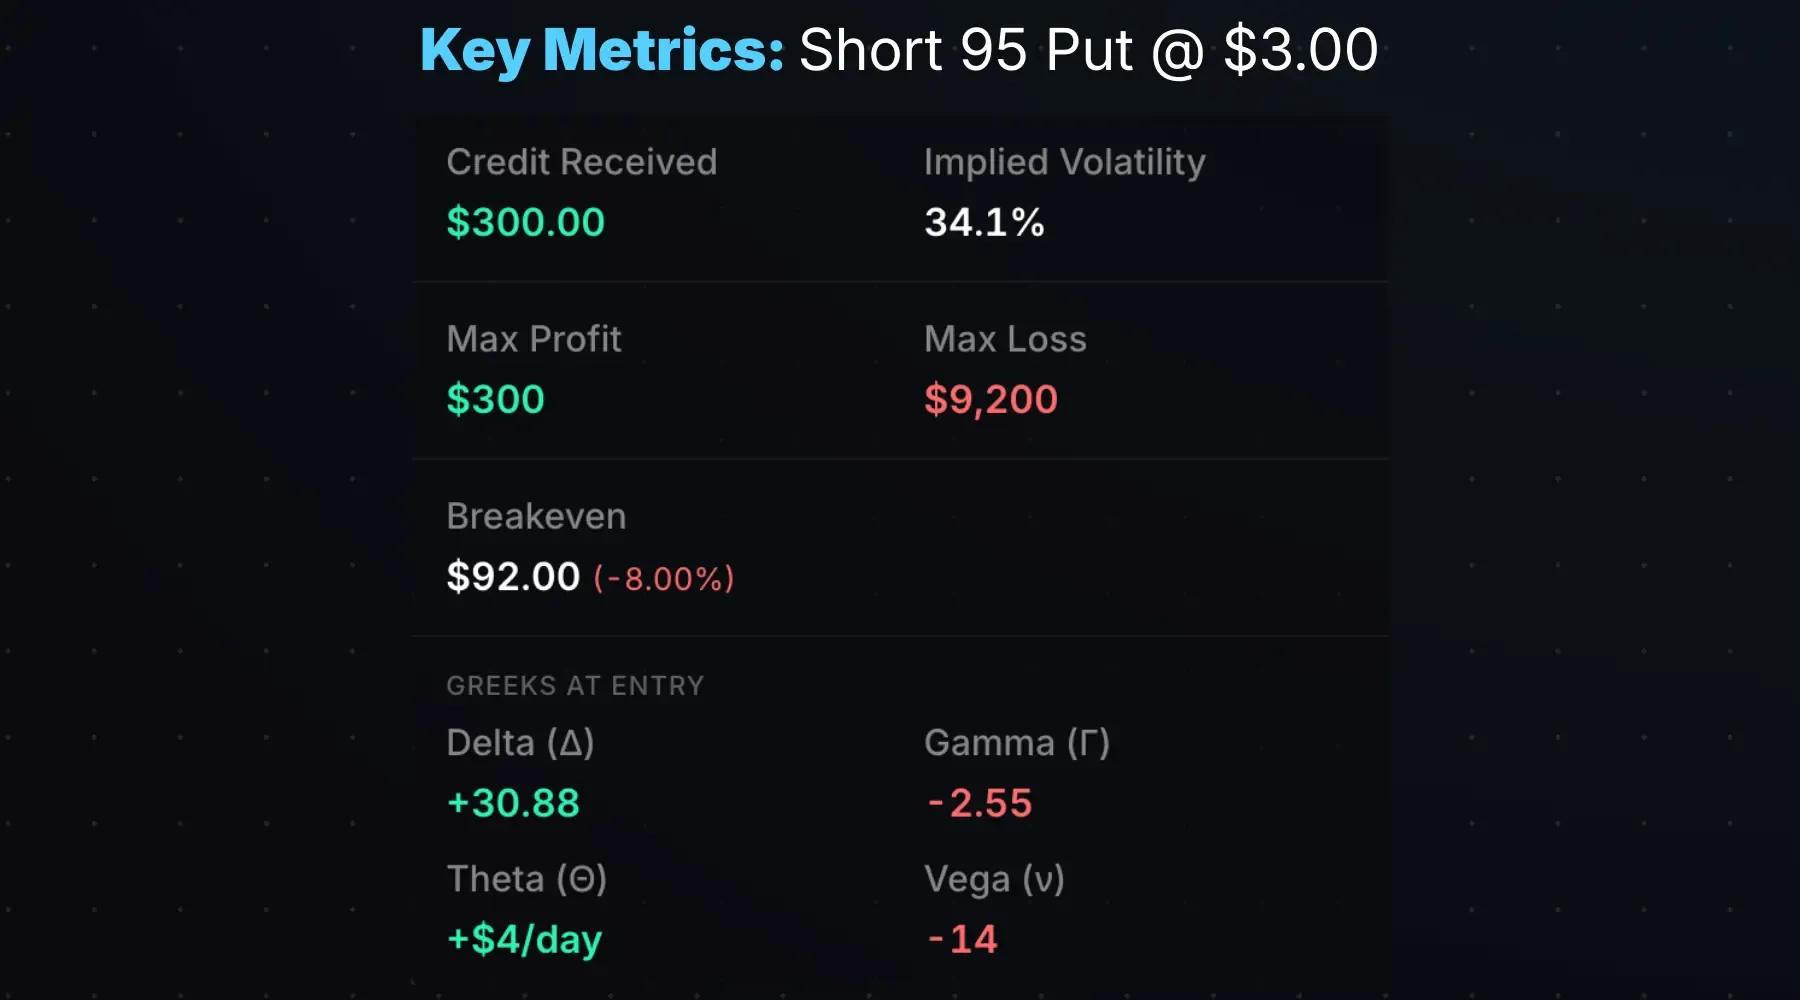
The breakeven of $92 gives the stock 8% room to fall before the trade loses money (at expiration). While not unlimited like a short call, the max loss of $9,200 is substantial, but only occurs if the stock falls to zero.
This risk profile is why brokers require margin to sell naked short puts.
How the Greeks Affect a Short Put
A short put has positive delta, negative gamma, positive theta, and negative vega.
| Greek | Exposure | What It Means |
|---|---|---|
| Delta (Δ) | Positive | Profits when the stock rises |
| Gamma (Γ) | Negative | Delta moves against you as the stock falls |
| Theta (Θ) | Positive | Time decay benefits the position |
| Vega (ν) | Negative | Rising IV hurts; falling IV helps |
Here’s a short 95 put on HOOD sold for $4.88 with 52 DTE. The stock is at $105.39, about 10% above the strike:
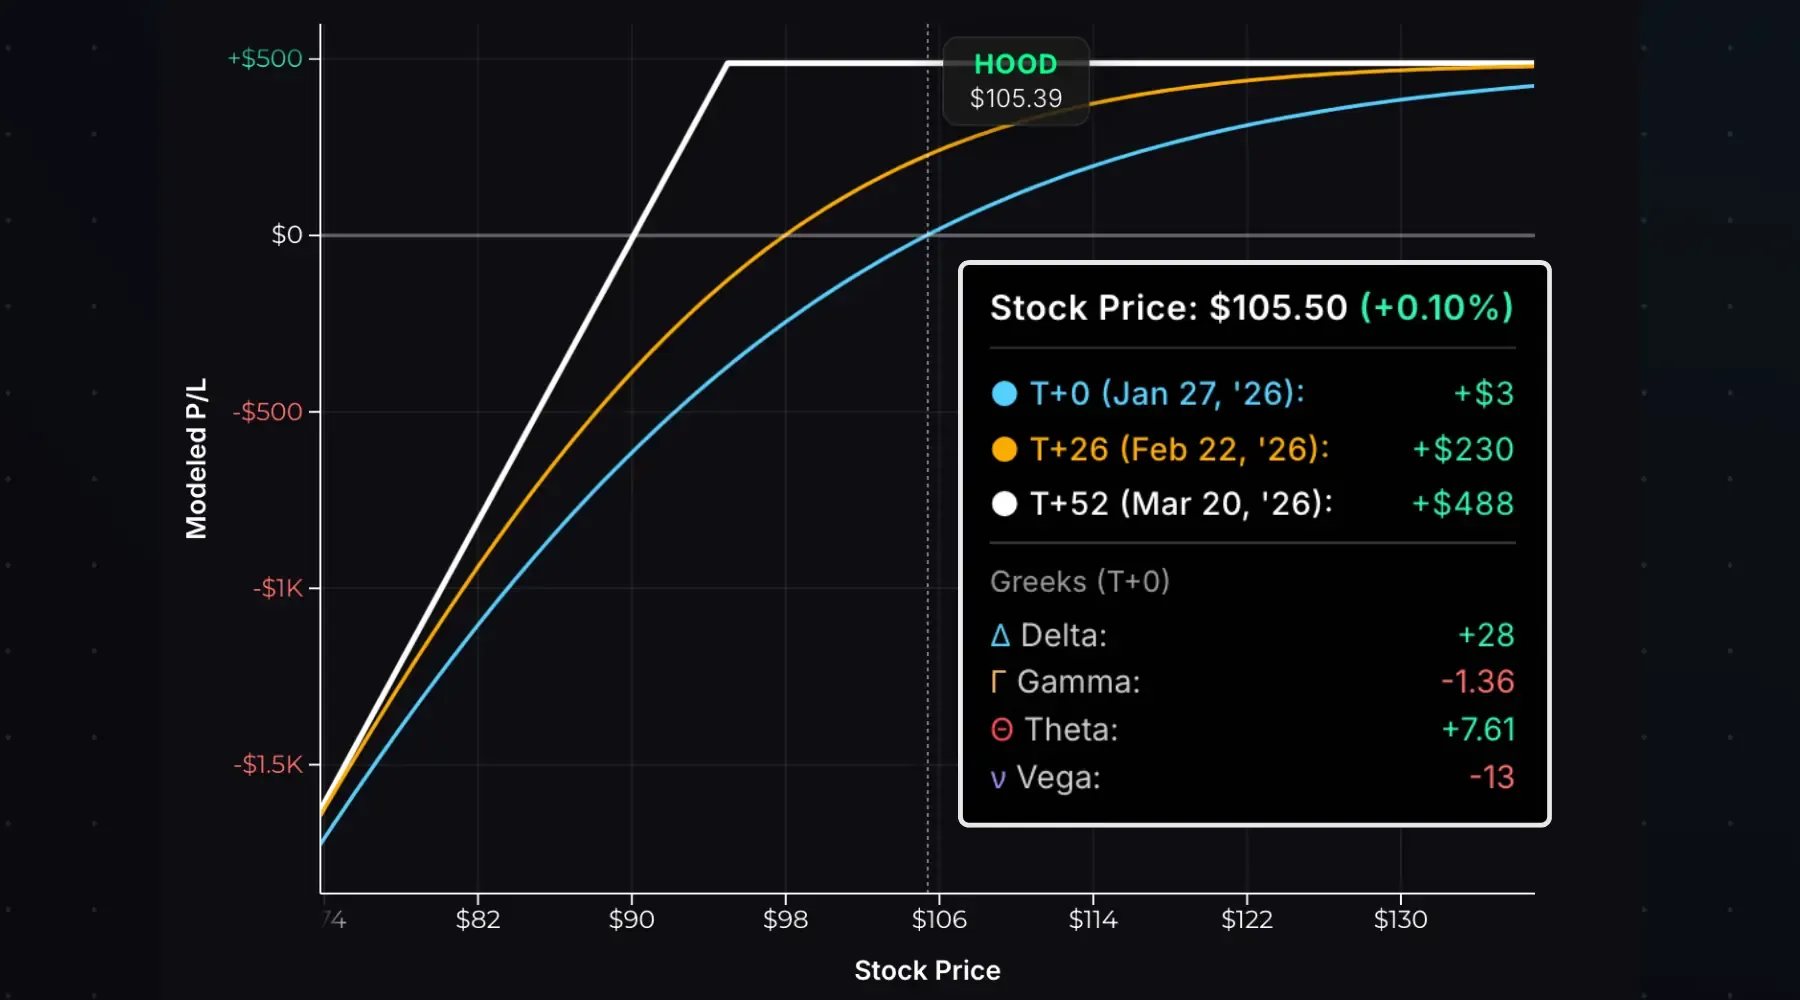
At entry, delta is +28, so the position gains roughly $28 for every $1 increase in HOOD. Theta is +7.61, meaning the position earns about $7.61 per day from time decay if HOOD stays flat.
If the stock rallies to $120, the put will be deep OTM:
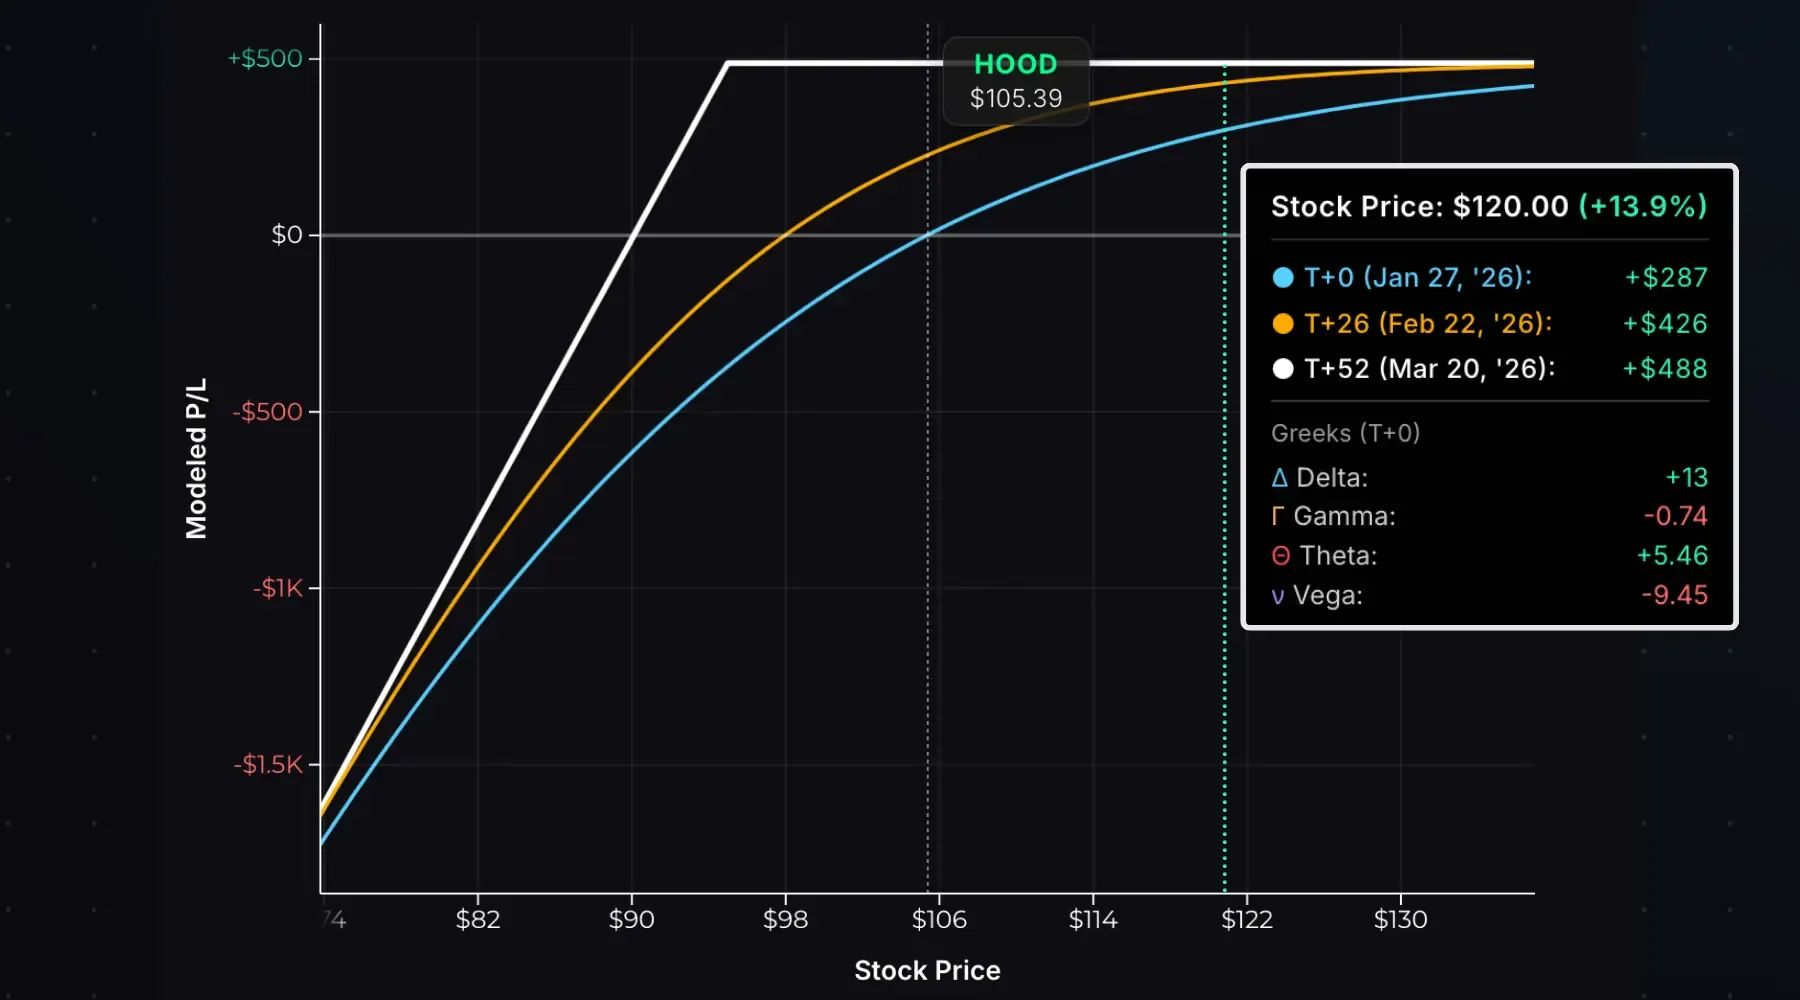
The T+0 P/L shows +$287, over halfway to the $488 max profit with the stock 14% above entry. Delta shrinks to +13 and theta drops to +5.46. The position is less sensitive to all variables, but has little value left to capture.
Now consider a drop to $80:
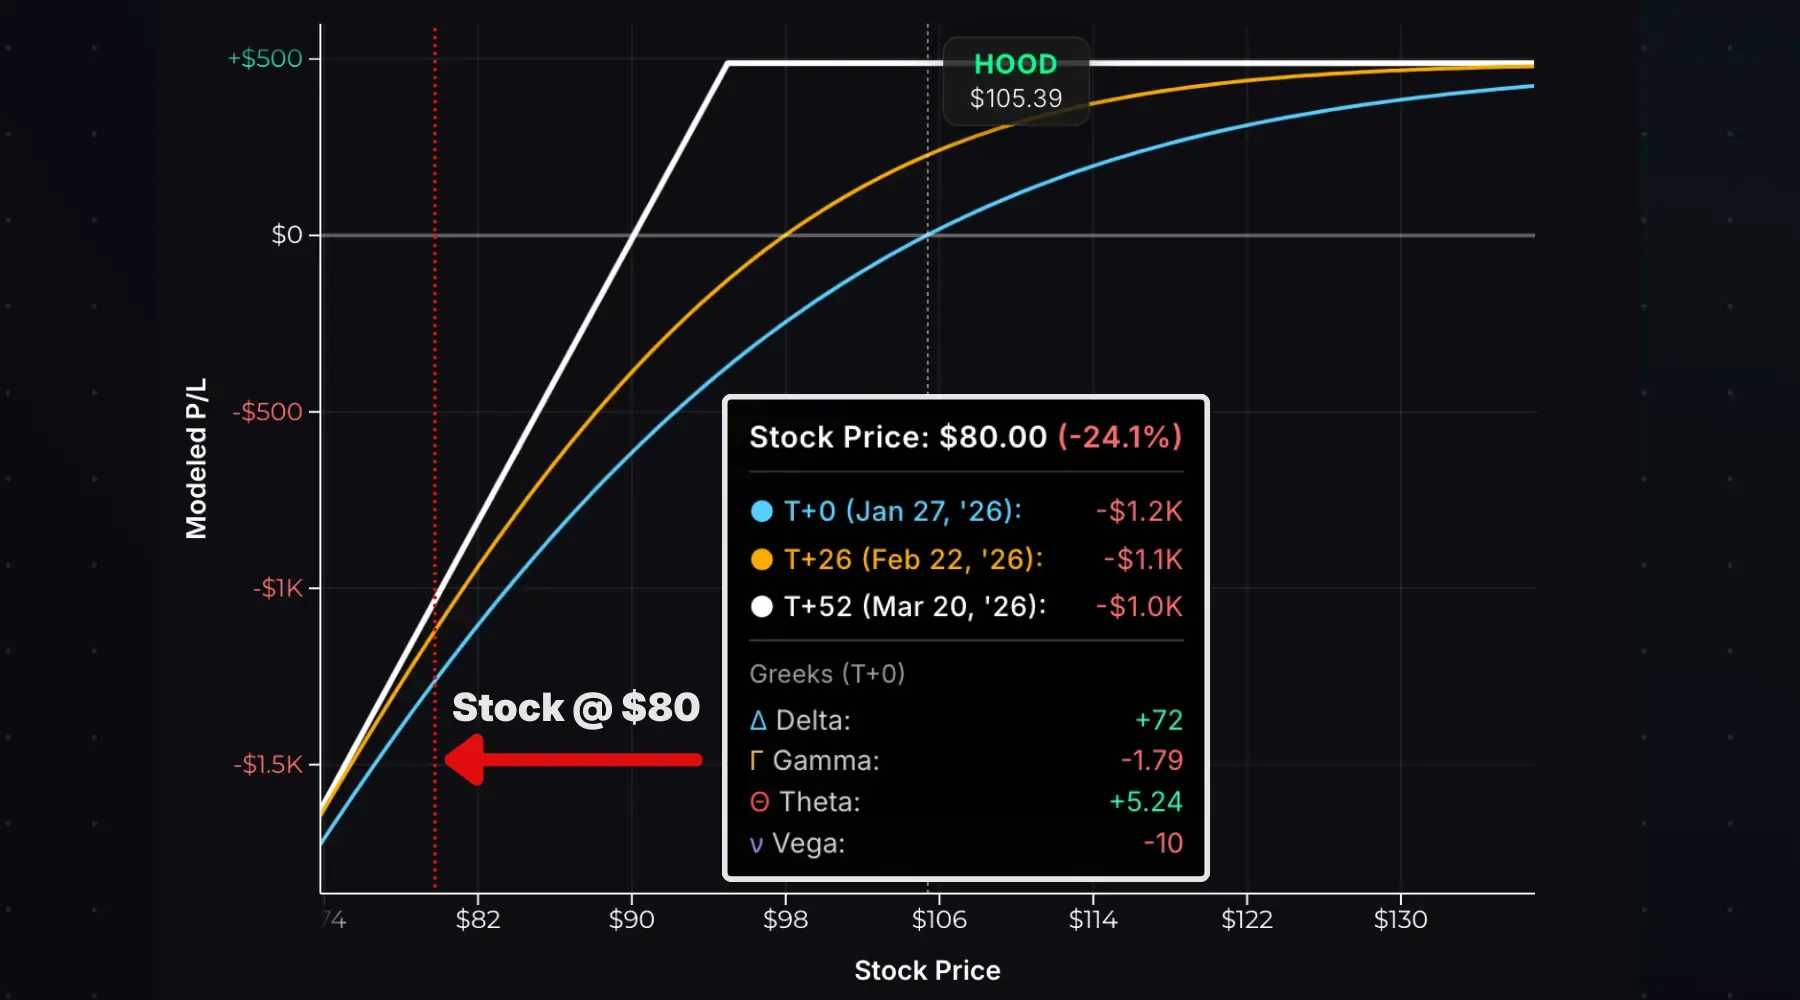
Delta balloons to +72 and the T+0 P/L shows -$1,200. At expiration, the loss would be -$1,000, only slightly better than the loss earlier in the trade since the put is ITM with mostly intrinsic value. As the stock continues falling, delta approaches +100. The short put behaves like long stock, losing $100 per $1 move down.
This is negative gamma in action. Delta grows larger as the stock drops, accelerating losses if the decline continues.
Time Decay Impact
Time decay is a key profit driver for a short put. If the stock stays above the put strike as time passes, the put’s extrinsic value erodes, allowing you to buy it back cheaper.
The chart below shows how P/L evolves over time with HOOD at $105.50, near the entry price:
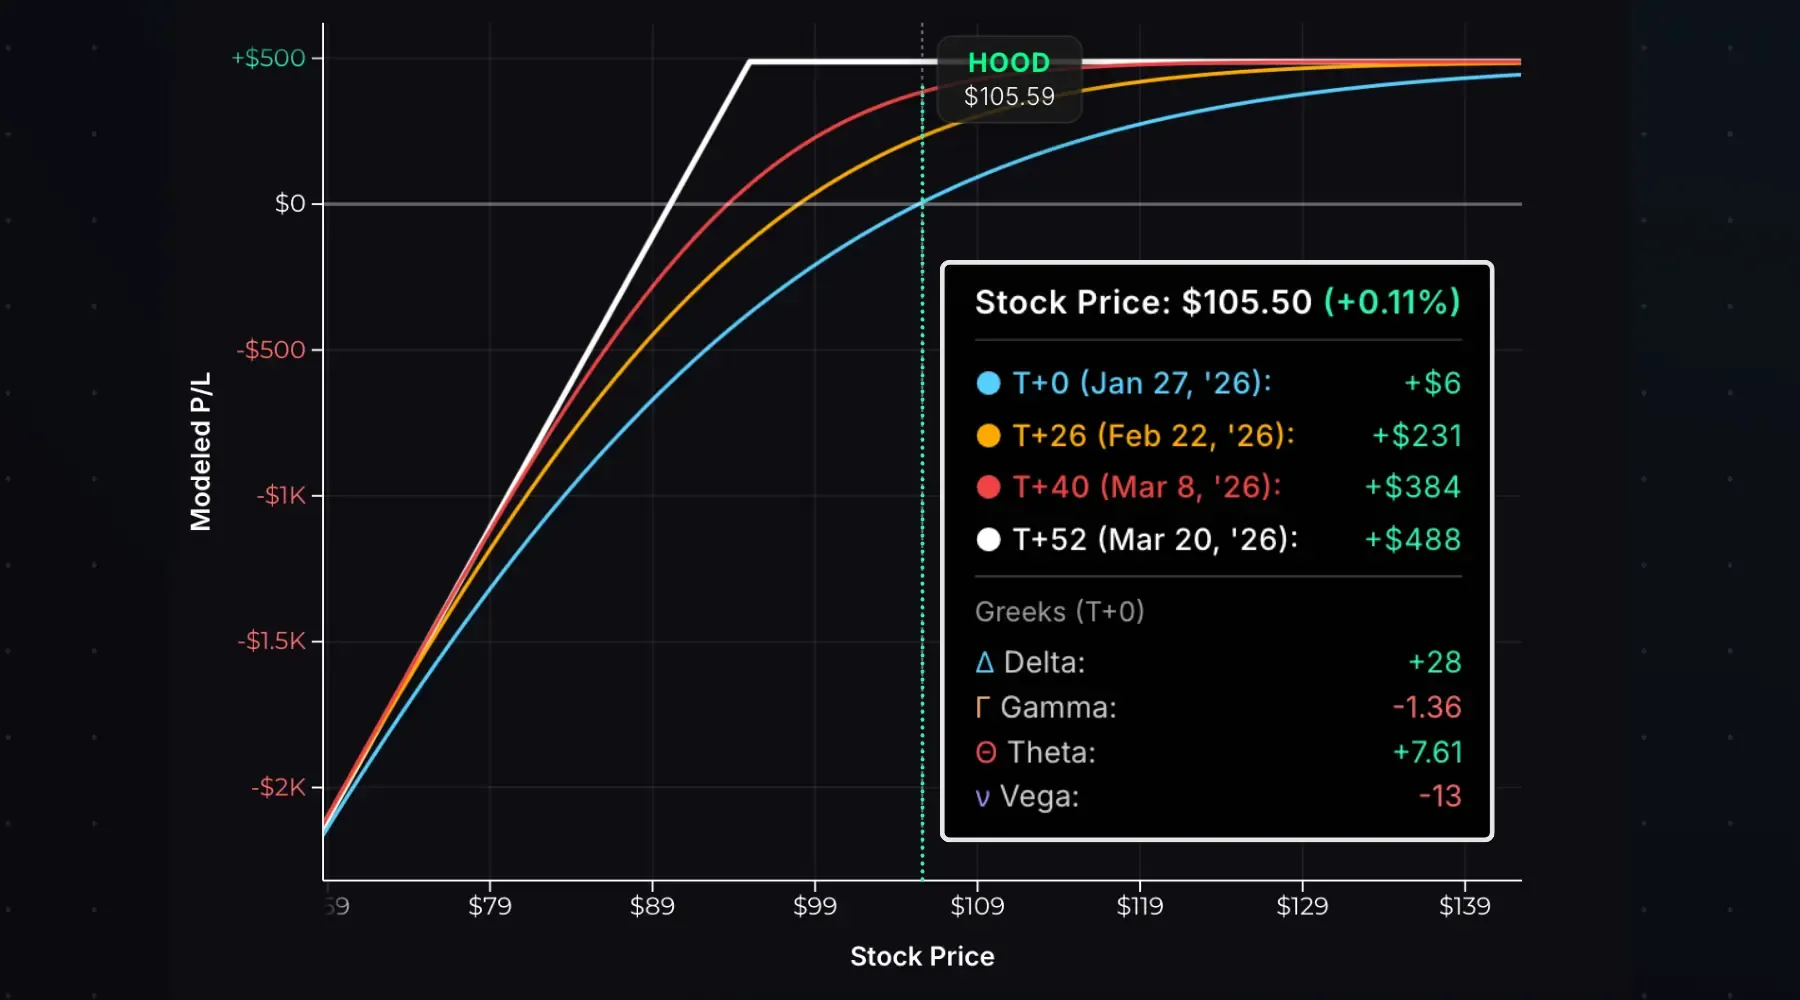
| Time | P/L |
|---|---|
| T+0 (Entry) | $0 |
| T+26 | +$231 |
| T+40 | +$384 |
| T+52 (Expiration) | +$488 |
With the stock 10% above the strike, the put steadily decays. By T+26 (halfway to expiration), you’ve captured 47% of max profit. By T+40, you’re at 79%. Many traders close at 50–75% of max profit rather than waiting for expiration since there’s little left to gain while still being exposed to all of the risk.
OTM Theta Decay Curve
The HOOD put was OTM; the stock was 10% above the strike. OTM options decay faster on a percentage basis than ATM options. The chart below shows a 45-day 90 put on a $100 stock with 35% IV, assuming the stock stays pinned at $100:
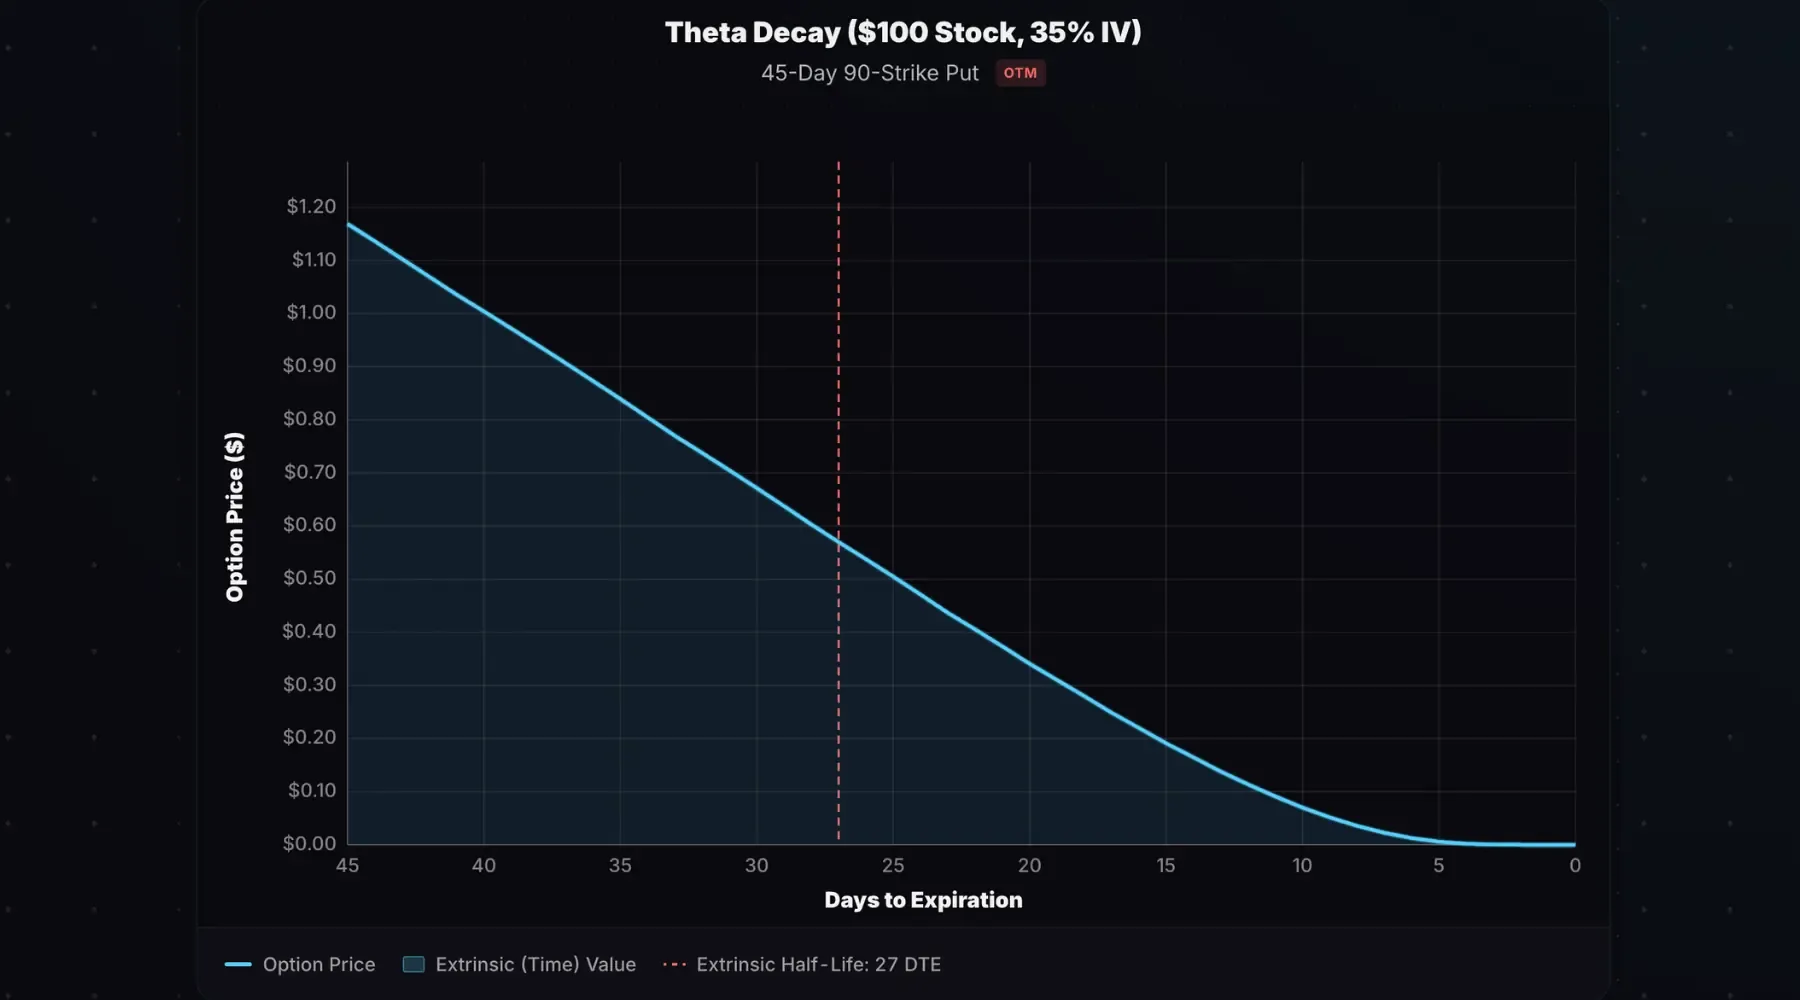
The put loses half of its value by 27 DTE and nearly all of it by 5 DTE. This front-loaded decay benefits OTM short put sellers, as you capture most of your profit well before expiration if the option remains OTM.
Model decay curves like this one with the theta decay curve calculator.
Implied Volatility Impact
Short puts are short volatility. The position has negative vega, so it profits when implied volatility falls and loses when IV rises.
The chart below shows the impact of an immediate 10% IV decrease on the HOOD short put:
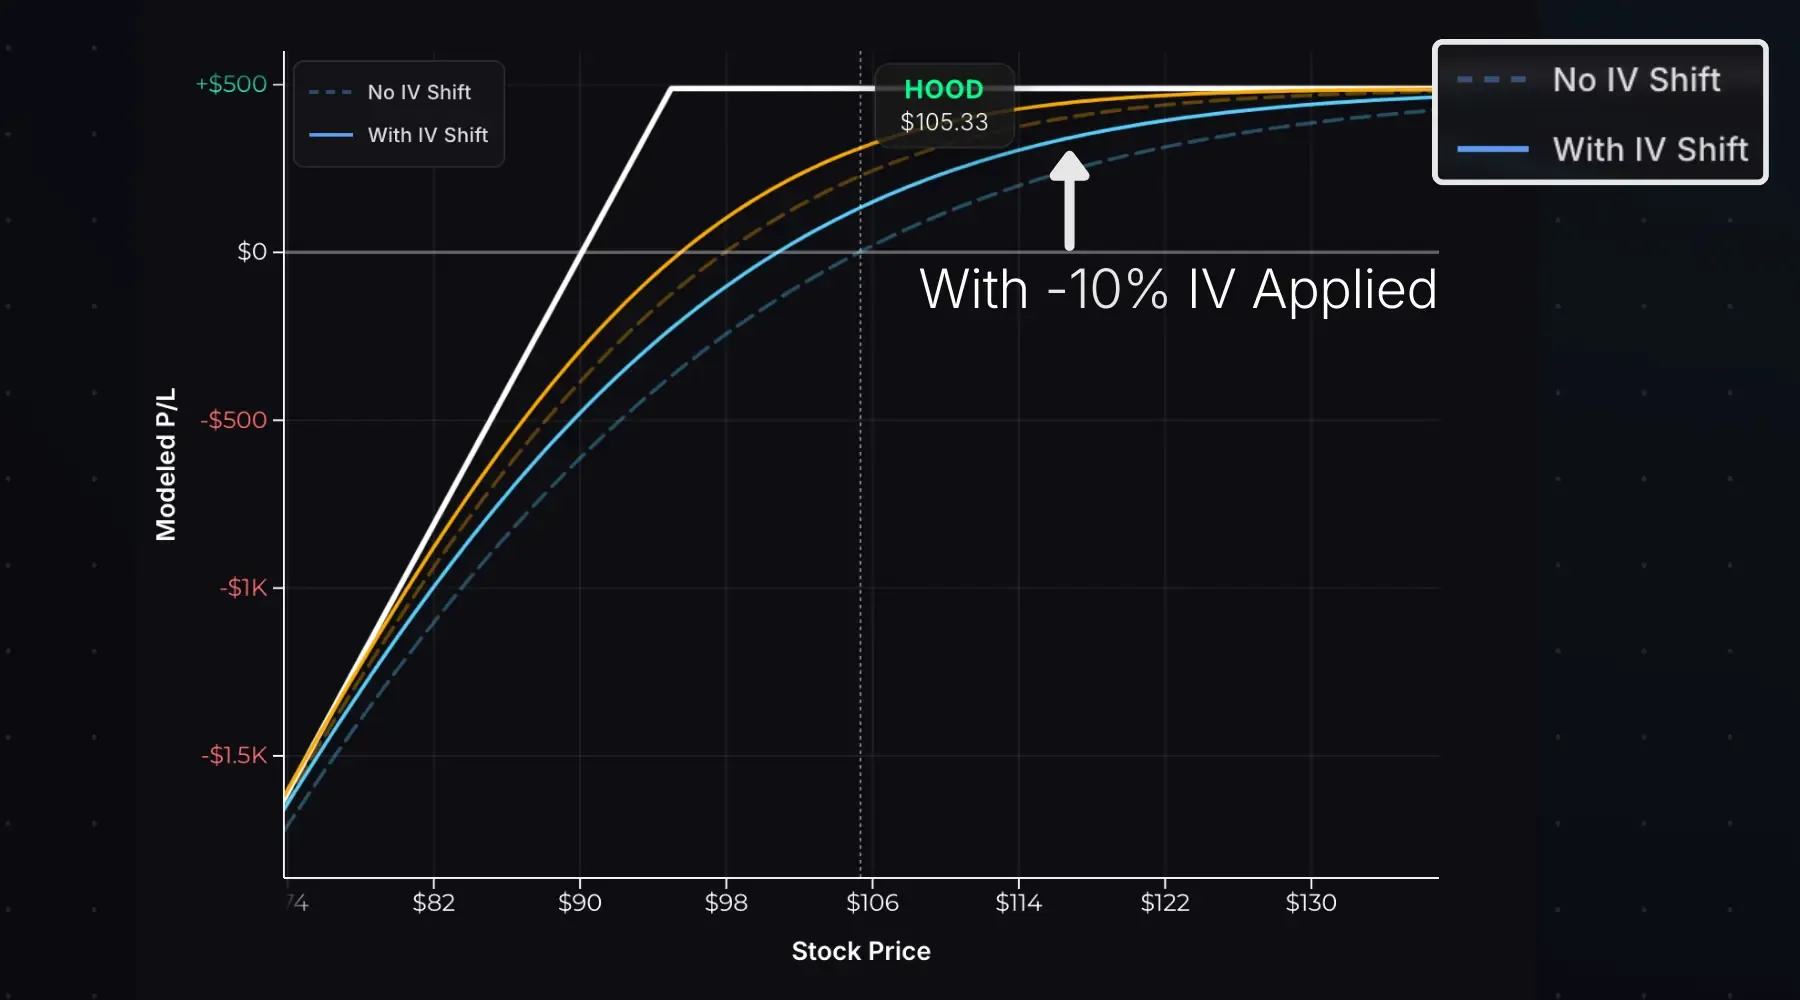
The dashed lines show the original T+0 and T+27 P/L curves. The solid lines show projected P/L with IV 10% lower after selling the put. Both curves shift higher, and the position is more profitable at every stock price. Lower IV means lower put prices, which helps when you’re holding a short put position.
Strike Selection
Strike selection determines your premium, probability of profit, and risk exposure.
Consider a $100 stock with 45-day options at 30% IV:
| Strike | Delta | Premium | Breakeven | Prob. OTM |
|---|---|---|---|---|
| 100 (ATM) | +46 | $3.92 | $96.08 | ~54% |
| 95 (OTM) | +27 | $1.91 | $93.09 | ~73% |
| 90 (OTM) | +13 | $0.75 | $89.25 | ~87% |
ATM strikes collect more premium, but have a lower probability of expiring worthless. OTM strikes collect less premium, but give the stock more room to fall.
Entry, Exit, and Expiration
To enter: Sell-to-open (STO) a put. You receive a credit immediately. You’ll need available capital to cover the margin requirement.
To exit before expiration: Buy-to-close (BTC) the put. You pay a debit. Profit = credit received − debit paid.
Profit target: Many traders close at 50–75% of max profit. If you sold a put for $4.88 and it’s now worth $1.22, you’ve captured $3.66 (75%) of the potential profit. Closing early is wise since you’ve made 75% of the potential gain, but still hold all of the risk.
Expiration scenarios for a 95 put sold for $3.00:
| Stock at Expiration | Result |
|---|---|
| $100 (above strike) | Put expires worthless. You keep the full $300 credit. |
| $94 (within breakeven) | Put $1 ITM. Assigned, buy shares at $95. Net profit: $200. |
| $80 (beyond breakeven) | Put $15 ITM. Assigned, buy shares at $95. Net loss: $1,200. |
If assigned, you’ll own 100 shares at the strike price. Your effective cost basis is the strike minus the premium received ($95 − $3 = $92).
However, if you don’t have the necessary capital to hold the stock, you’ll be forced to sell the shares (or your brokerage will close them for you).
Early Assignment
Short puts can be assigned early, though it’s less common than with short calls since there’s no dividend incentive.
Early assignment typically only happens when the put is deep ITM with little extrinsic value remaining, usually near expiration. If assigned, you buy 100 shares at the strike price.
To manage assignment risk: Monitor deep ITM short puts as expiration approaches. If extrinsic value is near zero, expect assignment. If you don’t want the shares, close the position.
Short Put vs Cash-Secured Put
A cash-secured put is a short put where you set aside enough cash to buy the shares if assigned.
Example: you sell a 90-strike put. Buying 100 shares at $90 requires $9,000 in cash set aside for the duration of the trade.
| Naked Short Put | Cash-Secured Put | |
|---|---|---|
| Capital Reserved | None (margin only) | Full cash to buy shares |
| Max Profit | Premium received | Premium received |
| Max Loss | (Strike − premium) × 100 | (Strike − premium) × 100 |
| Assignment Result | Buy shares (forced liquidation without necessary capital) | Buy shares (cash ready) |
The risk/reward is identical; the difference is capital efficiency. Naked puts on margin require less capital, but carry the risk of a margin call if the stock drops sharply. Cash-secured puts tie up more capital, but eliminate margin call risk since you’re able to buy the shares with the cash reserve.
Short Put vs Long Call
Both strategies profit when the stock rises, but the risk profiles differ.
| Short Put | Long Call | |
|---|---|---|
| Entry | Credit | Debit |
| Max Profit | Limited (premium received) | Unlimited |
| Max Loss | Substantial (strike − premium) | Limited (premium paid) |
| Theta | Positive (time helps) | Negative (time hurts) |
| Vega | Negative (falling IV helps) | Positive (rising IV helps) |
| Use When | Neutral-to-bullish, elevated IV | Strongly bullish, low IV |
If you expect a modest rise or sideways action, the short put profits from time decay without needing the stock to move. If you expect a sharp rally, the long call offers unlimited profit potential with defined risk.
Short Put vs Bull Put Spread
A bull put spread adds a long put below the short put, defining your risk.
| Short Put | Bull Put Spread | |
|---|---|---|
| Risk | Substantial | Defined (spread width − credit) |
| Max Profit | Higher | Lower (long put reduces credit) |
| Max Loss | Strike − premium | Capped (spread width − credit) |
| Margin Required | Higher | Lower |
| Breakeven | Lower | Higher |
Example: Stock at $100.
- Short put: Sell 95 put for $3.00 → max profit $300, max loss $9,200
- Bull put spread: Sell 95 put, buy 85 put for $1.50 net credit → max profit $150, max loss $850
The bull put spread sacrifices $150 of profit potential to cap the max loss at $850. For most scenarios, this tradeoff makes sense.
- A short put sells the obligation to buy shares at the strike price, collecting premium upfront.
- Max profit equals the premium received; max loss is substantial, at (strike − premium) × 100 if the stock falls to $0.
- Positive theta and negative vega: the position profits from time decay and falling IV.
- Without cash reserves to buy the shares, naked short puts are more speculative than cash-secured puts, and carry the risk of a margin call on sharp declines.
- Consider a cash-secured put if you don’t mind buying the shares, or a bull put spread if you want short put exposure with defined risk.
Related Resources
- Short Put Calculator: Visualize P/L and Greeks for any short put position
- What Is a Cash-Secured Put?: Short put with cash set aside for assignment
- What Is a Bull Put Spread?: Add a long put to define your risk
- What Is a Long Call?: Bullish alternative with defined risk
- What Is a Long Put?: Buy a put instead of selling one
- What Is Theta?: Understanding time decay
- What Is Implied Volatility?: Why IV matters for short premium trades