What Is a Long Straddle?
Long straddle options strategy explained visually: payoff diagrams, Greeks tables, and examples showing how the strategy works.
A long straddle combines buying a call and put at the same strike price, typically at-the-money (ATM). Both options share the same expiration date. You pay a debit at entry, equal to the call premium plus the put premium. Buying straddles is a long volatility strategy: it profits when the stock makes a large move in either direction.
Long Straddle Example
If a stock is at $50, a long straddle would be:
- Buy one 50 call for $2.50
- Buy one 50 put for $2.50
- Total Debit: $5.00
The straddle makes money if the stock moves beyond $45 or $55 by expiration. The total debit is your max loss. To profit at expiration, you need the stock to move more than $5 in either direction. Maximum profit is unlimited to the upside and significant to the downside (profits increasing until the stock hits zero).
Payoff Diagram
The long straddle payoff diagram has a V shape. Max loss occurs at the long strike price, with the straddle value increasing as the stock moves in either direction:
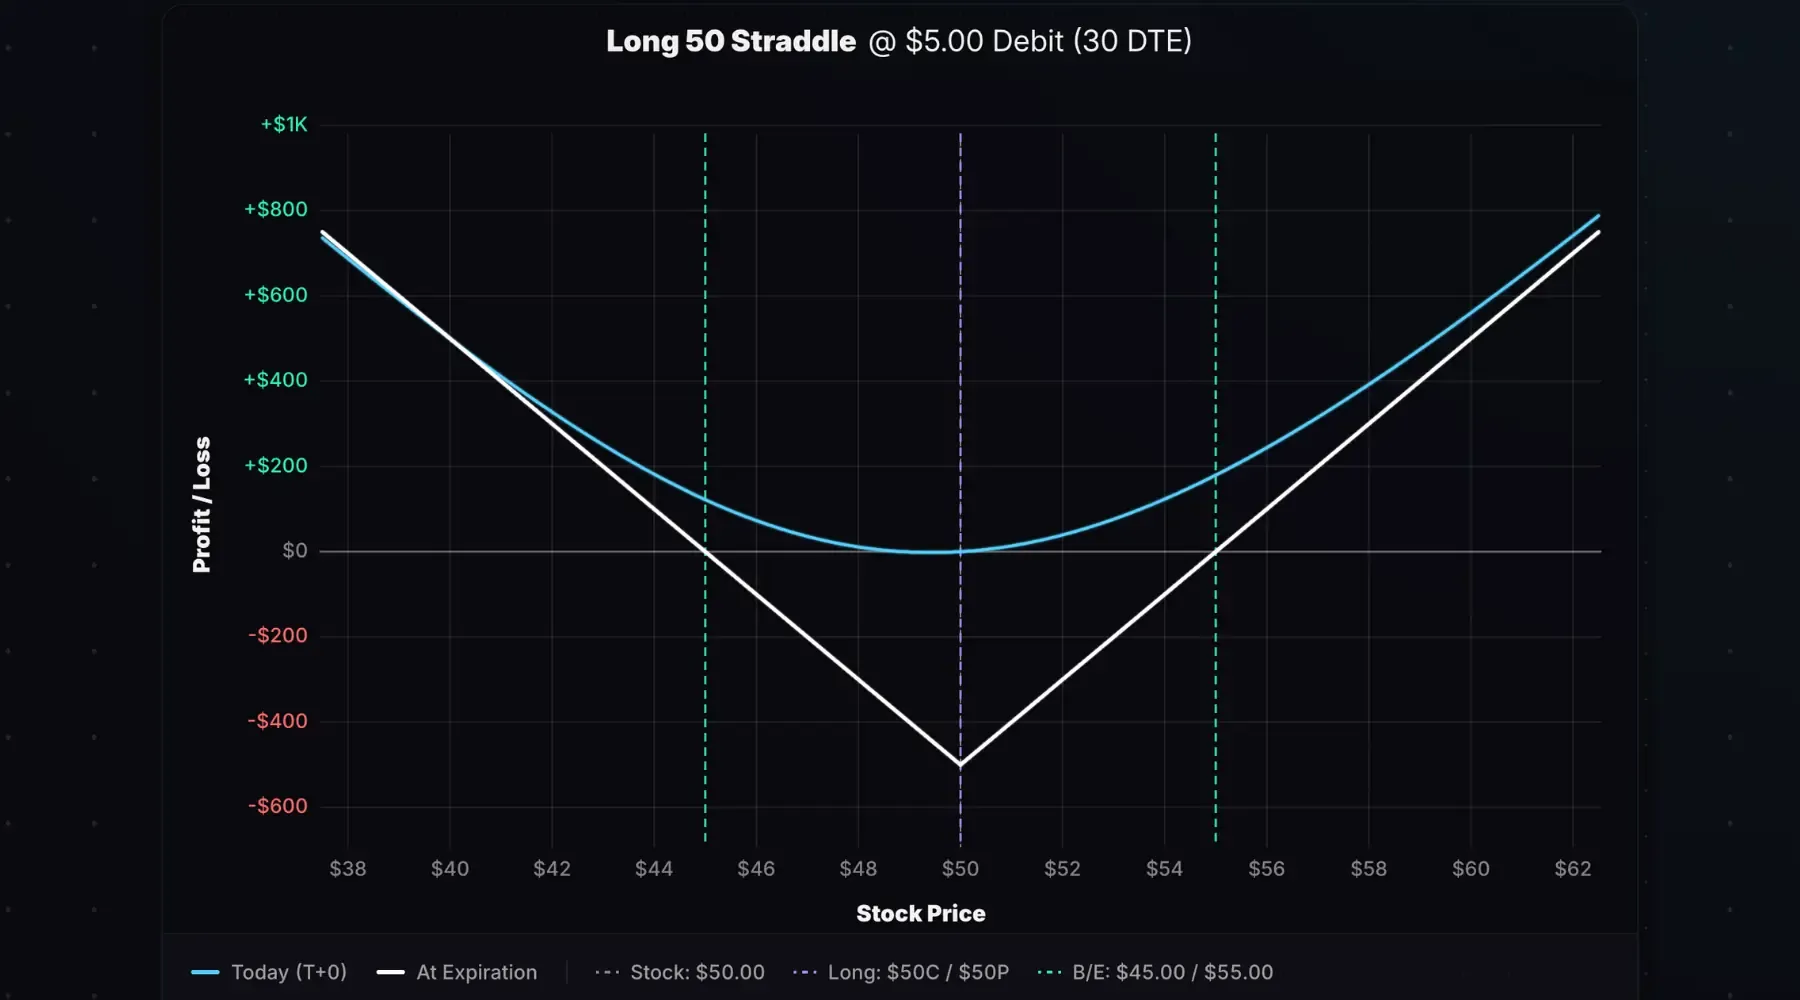
Stock at Entry: $50. Trade: Long 50 straddle entered for a $5.00 debit. 30 days to expiration (DTE).
The white line shows the payoff at expiration. The maximum loss of $500 occurs if the stock pins the $50 strike at expiration. The straddle value grows as the stock moves away from the long strike, unlimited to the upside, substantial to the downside (stock can fall to zero).
The cyan line (T+0) shows the modeled payoff at entry.
The difference between the T+0 and Expiration P/L lines shows time decay: if the stock doesn’t move big in either direction, the long straddle will lose money over time.
Key Characteristics
- Max Profit: Unlimited to the upside. To the downside, profit is capped at (strike price − total debit) × 100 per straddle (stock falls to zero).
- Max Loss: Total debit × 100 (per straddle). Occurs if the stock closes exactly at the strike price at expiration.
- Upper Breakeven: Strike price + total debit
- Lower Breakeven: Strike price − total debit
- Outlook: Volatile, expecting a large price move in either direction
Here are the metrics for a 50 straddle bought for $5.00 debit:
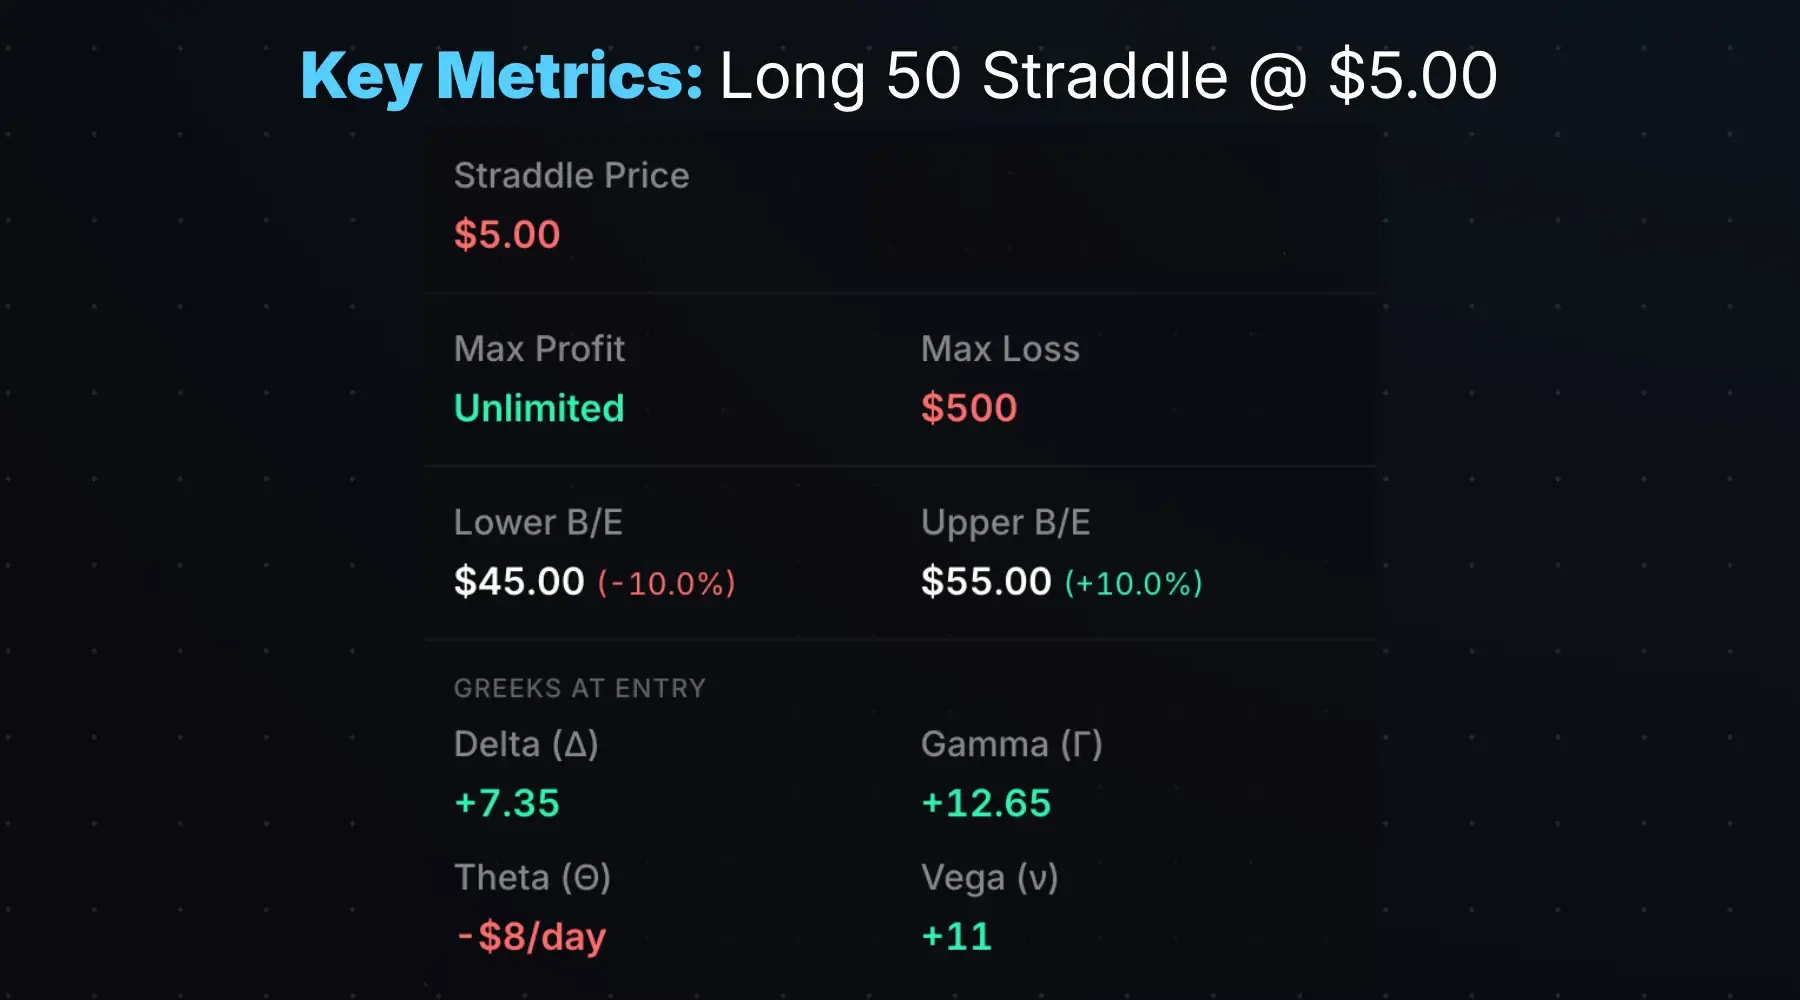
- Max Profit: Unlimited to the upside, up to $4,500 on the downside (if stock goes to zero)
- Max Loss: $500 (total debit × 100)
- Upper Breakeven: $55 (strike + debit)
- Lower Breakeven: $45 (strike − debit)
The stock needs to move beyond the breakevens to profit. Any close between $45 and $55 results in a loss at expiration, with max loss if the stock closes exactly at $50.
Since the stock closing exactly at $50 at expiration is near-zero probability, you’ll rarely lose the entire premium. But substantial losses occur if the stock is within a tight range around the strike near expiration.
How the Greeks Affect a Long Straddle
A long straddle has straightforward Greek exposures: positive gamma, positive vega, negative theta. Delta begins near zero for ATM straddles, making the trade market-neutral at entry.
| Greek | Exposure | What It Means |
|---|---|---|
| Delta (Δ) | Near Zero | Neutral at entry; shifts as the stock moves |
| Gamma (Γ) | Positive | Delta shifts in your favor as the stock moves |
| Theta (Θ) | Negative | Time decay hurts the position |
| Vega (ν) | Positive | Rising IV helps; falling IV hurts |
Here’s a 264 long straddle with an $11.03 entry cost on IWM with the stock at $263.98:
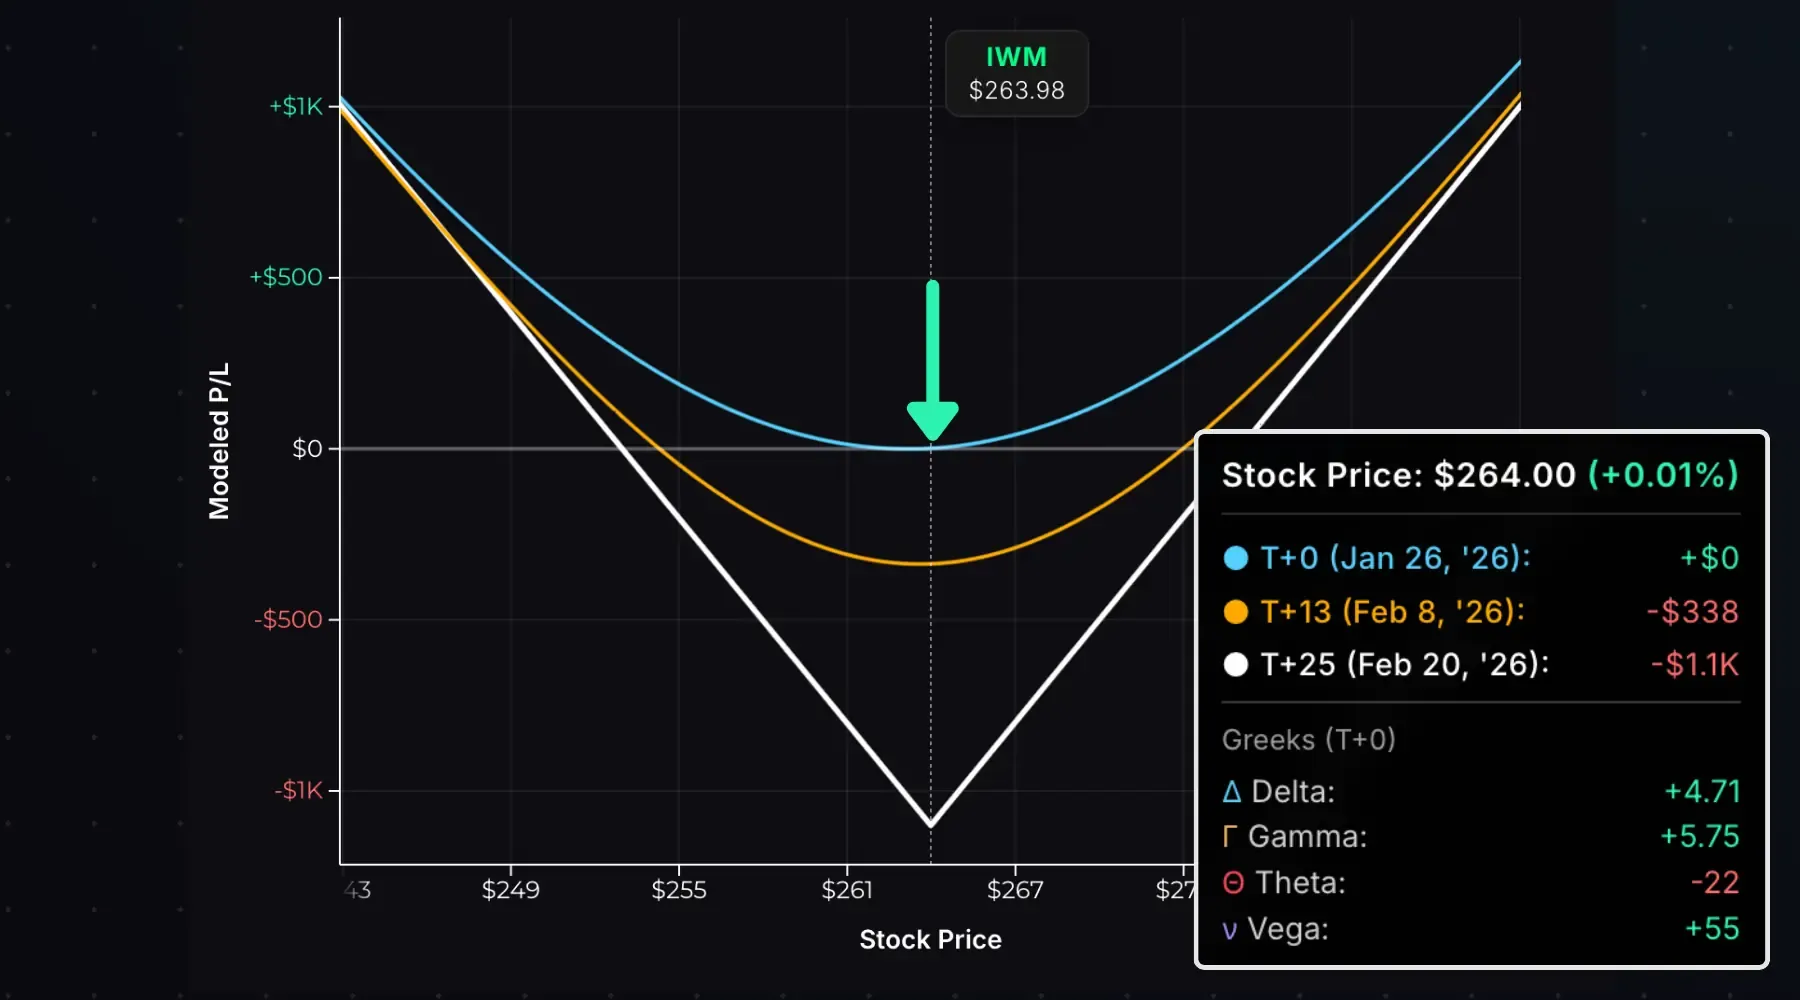
At entry, delta is near zero because the ATM call’s positive delta roughly offsets the ATM put’s negative delta. The flat T+0 P/L line shows low sensitivity to small stock price changes.
If the stock moves in either direction, delta shifts in your favor. Consider an immediate drop to $250:
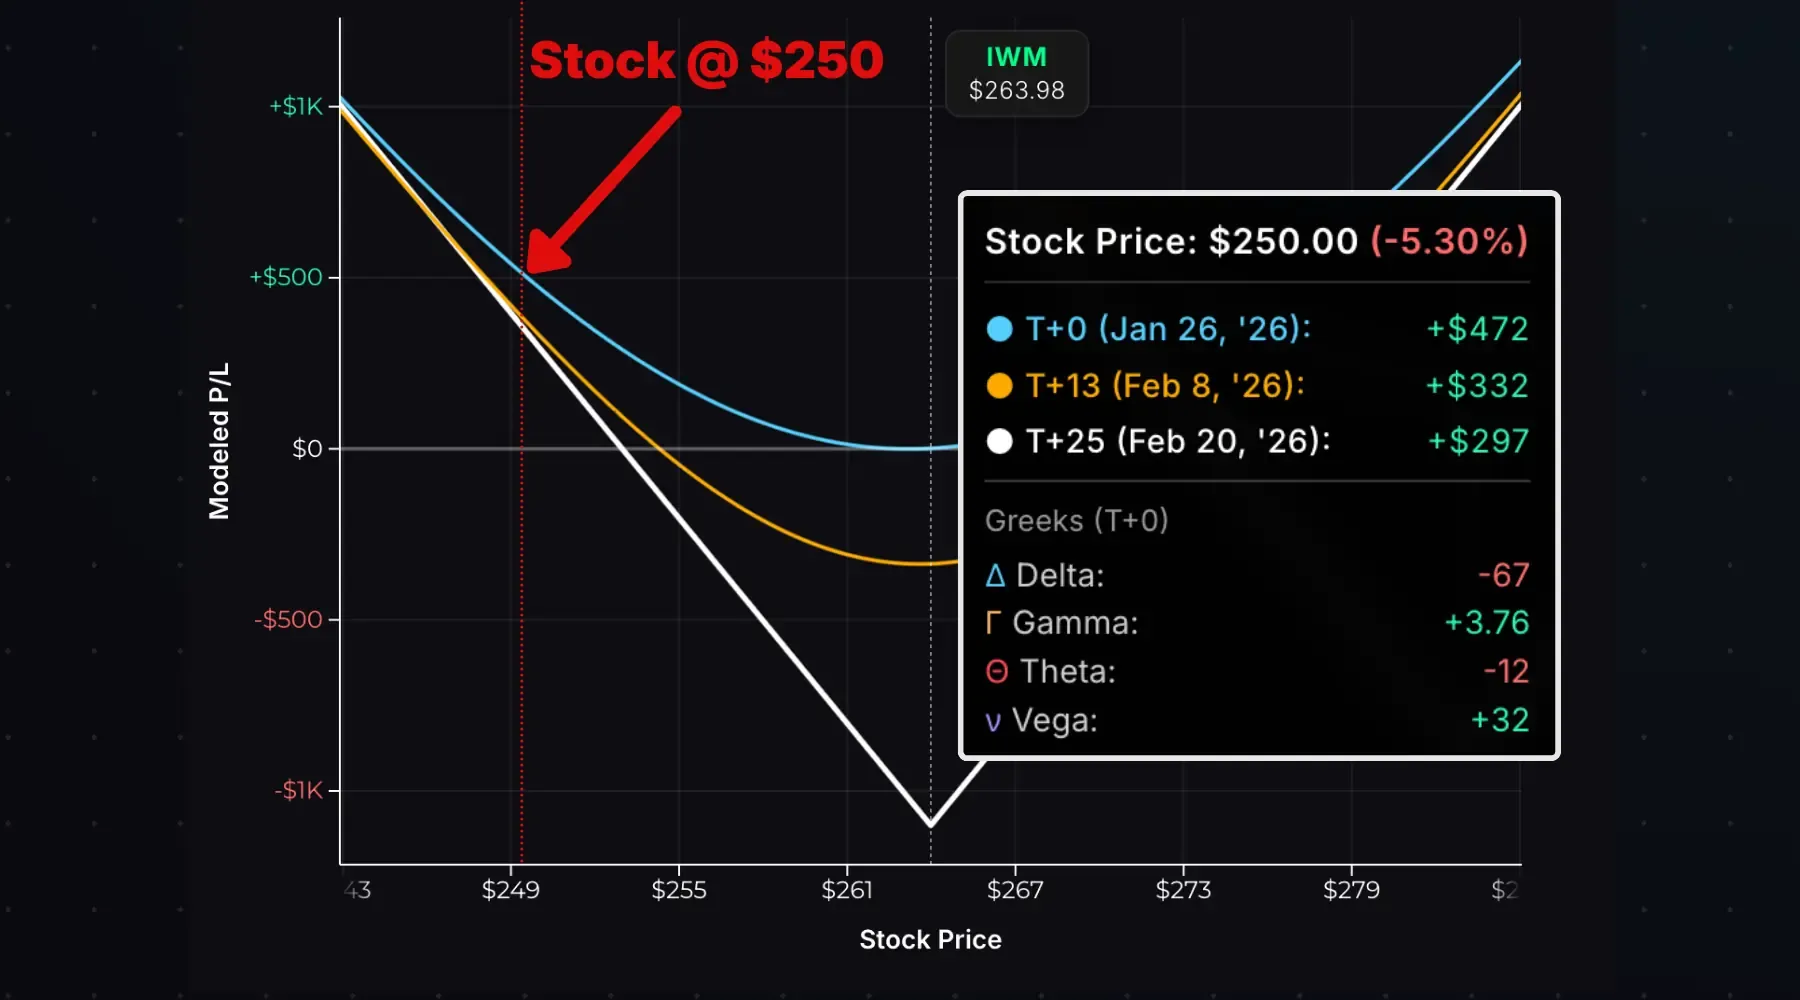
Delta is now -67, growing more negative as the stock collapses. The downward-sloping P/L lines reflect this negative delta. Profits accelerate as the stock continues falling, until delta maxes out at -100 (per straddle) and the position behaves like short stock.
Now consider a rally to $280:
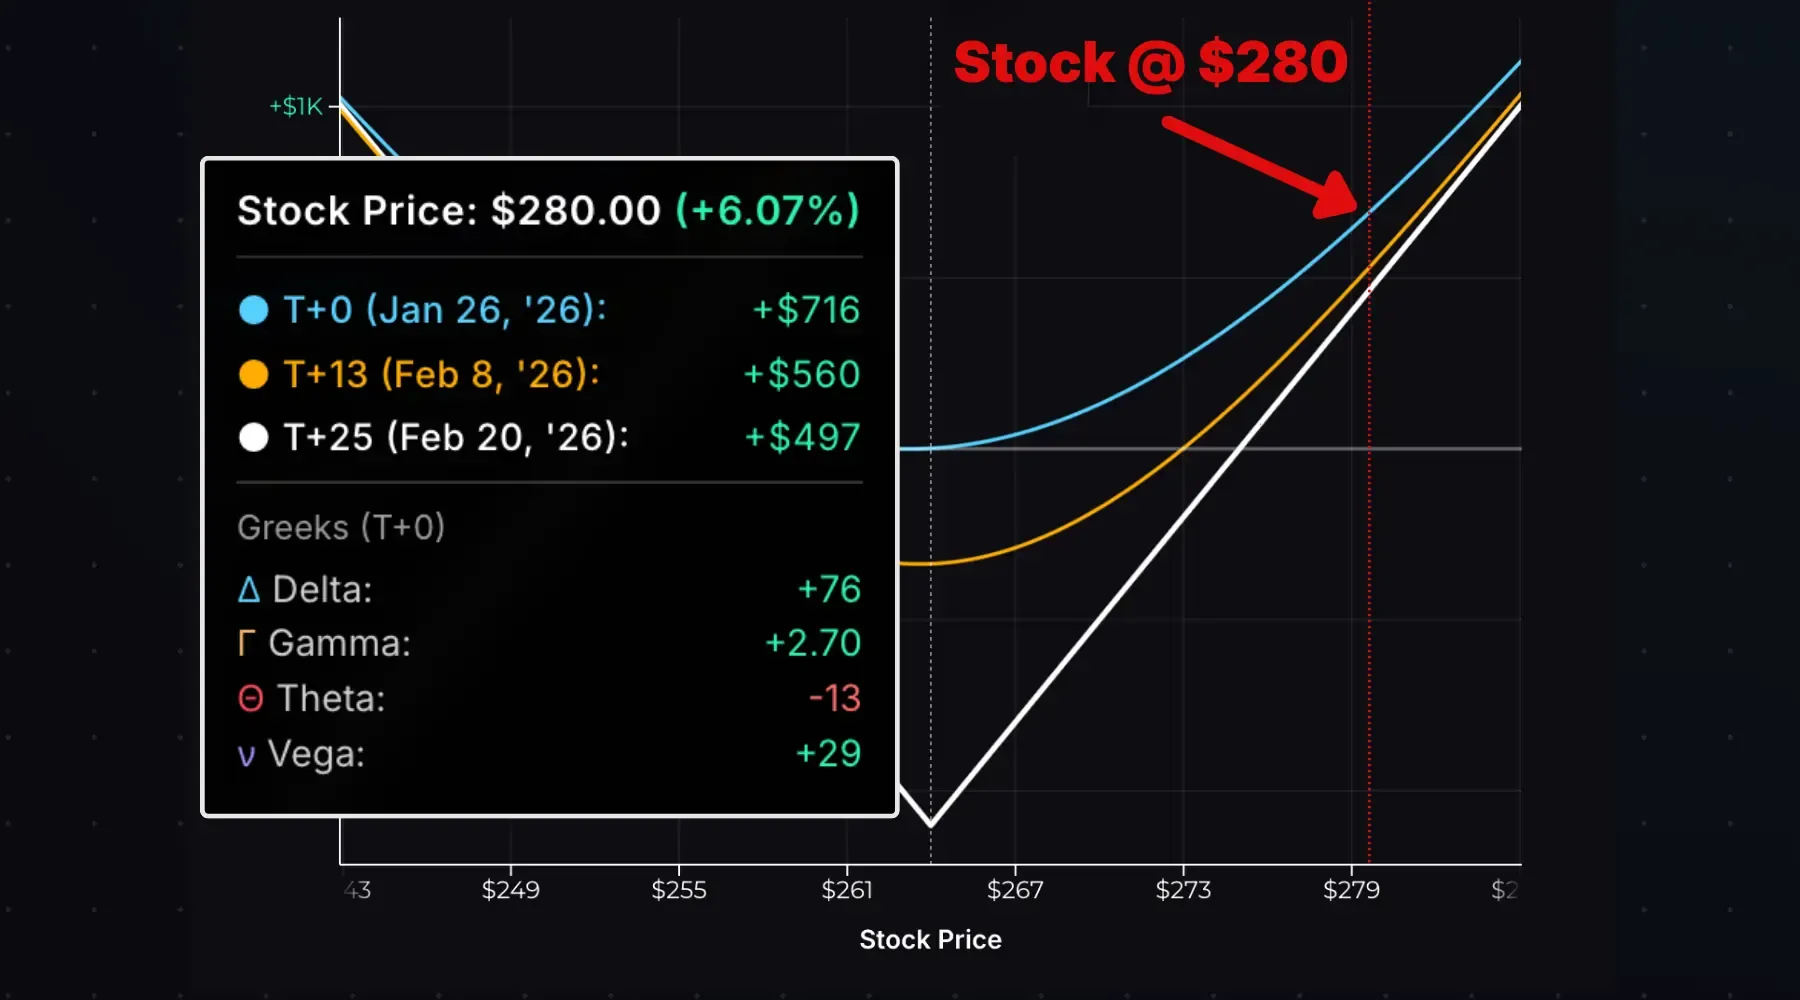
Delta is now +76, growing more positive as the stock price rises. The upward-sloping P/L lines reflect this positive delta. Profits accelerate as the stock continues rallying, until delta maxes out at +100 (per straddle) and the position behaves like long stock.
This is positive gamma in action: delta shifts in your favor when the stock moves away from the long strike.
Time Decay Impact
Time decay is the enemy of a long straddle. Both the long call and long put have negative theta, and ATM options have the highest extrinsic value, meaning they have the most to lose as time passes.
As expiration approaches, extrinsic value evaporates from both legs. If the stock stays near the strike, the straddle’s value drops and losses grow because the options are worth less.
The chart below visualizes time decay. The T+0 curve shows P/L at entry. The T+13, T+20, and T+25 curves show modeled P/L at future dates:
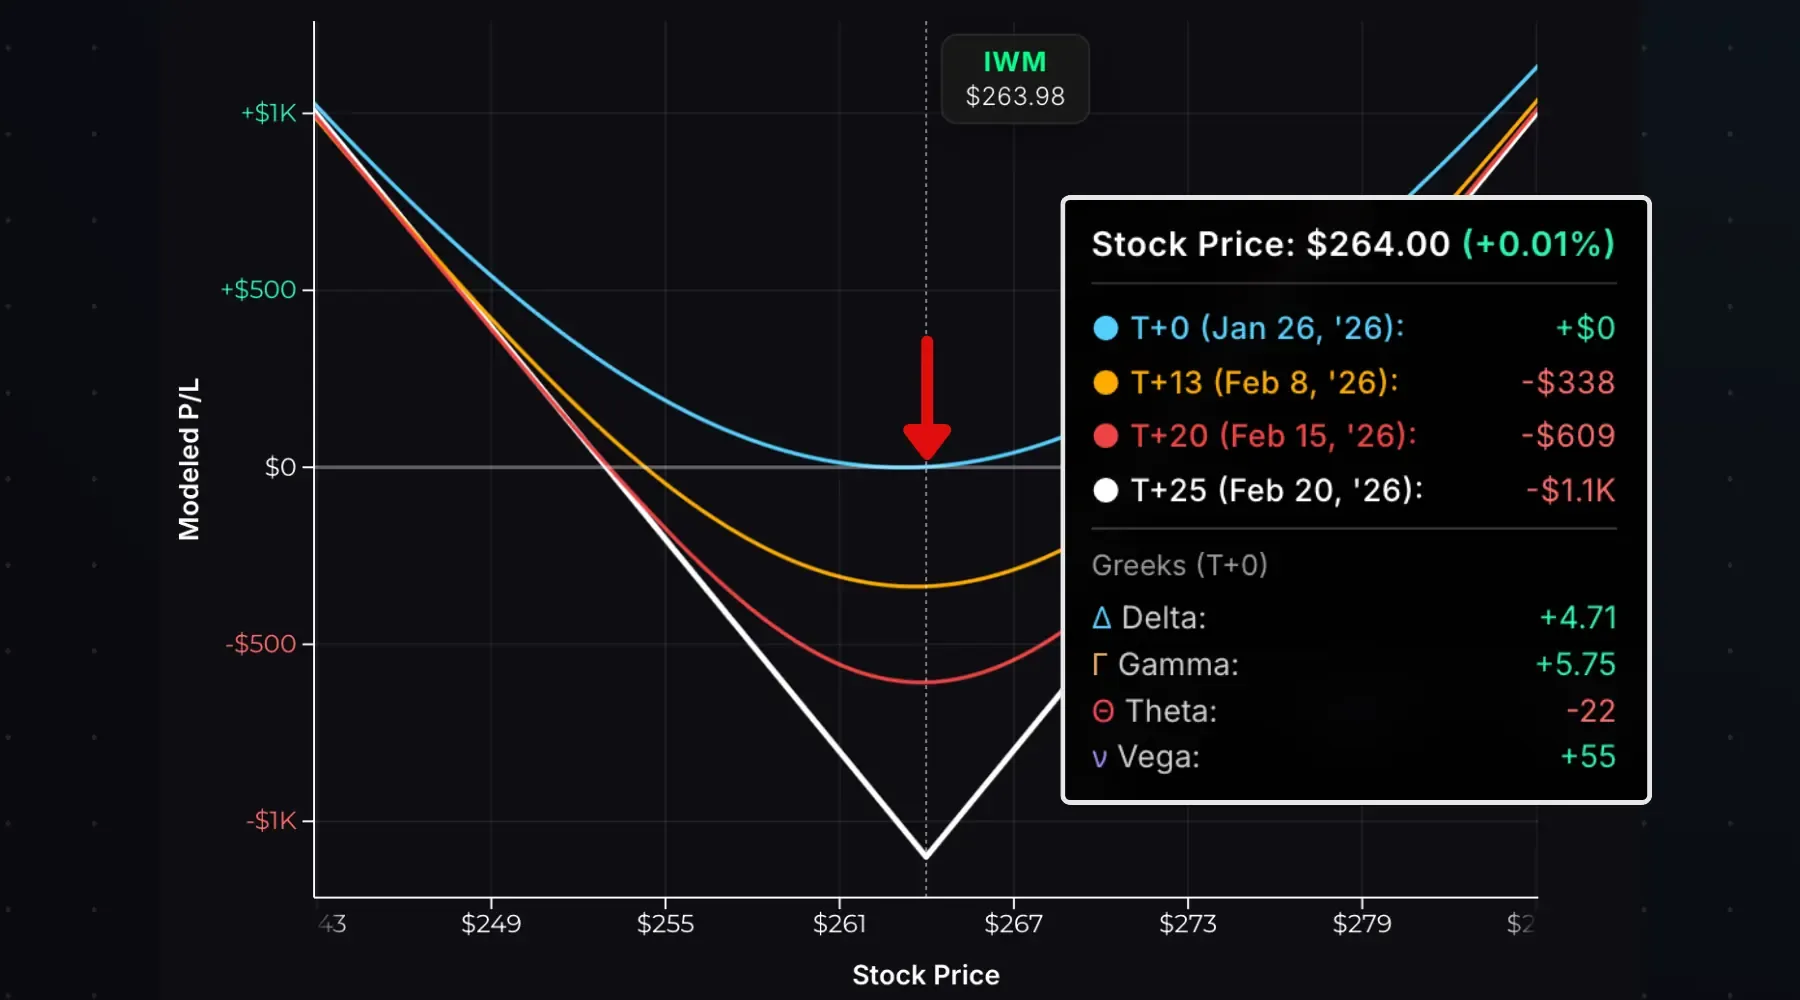
With the stock at the long strike ($264), here’s how the straddle price and P/L evolve:
| Time | Straddle Price | P/L |
|---|---|---|
| T+0 (Entry) | $11.03 | $0 |
| T+13 | $7.65 | −$338 |
| T+20 | $4.94 | −$609 |
| T+26 (Expiration) | $0.00 | −$1,103 |
As the straddle price falls, losses grow since the options you bought are worth less than you paid.
ATM Theta Decay Curve
ATM options don’t decay linearly. Theta is slow early and accelerates near expiration. The chart below visualizes the decay of a 30-day 250 call option assuming the stock stays pinned at $250 over time:
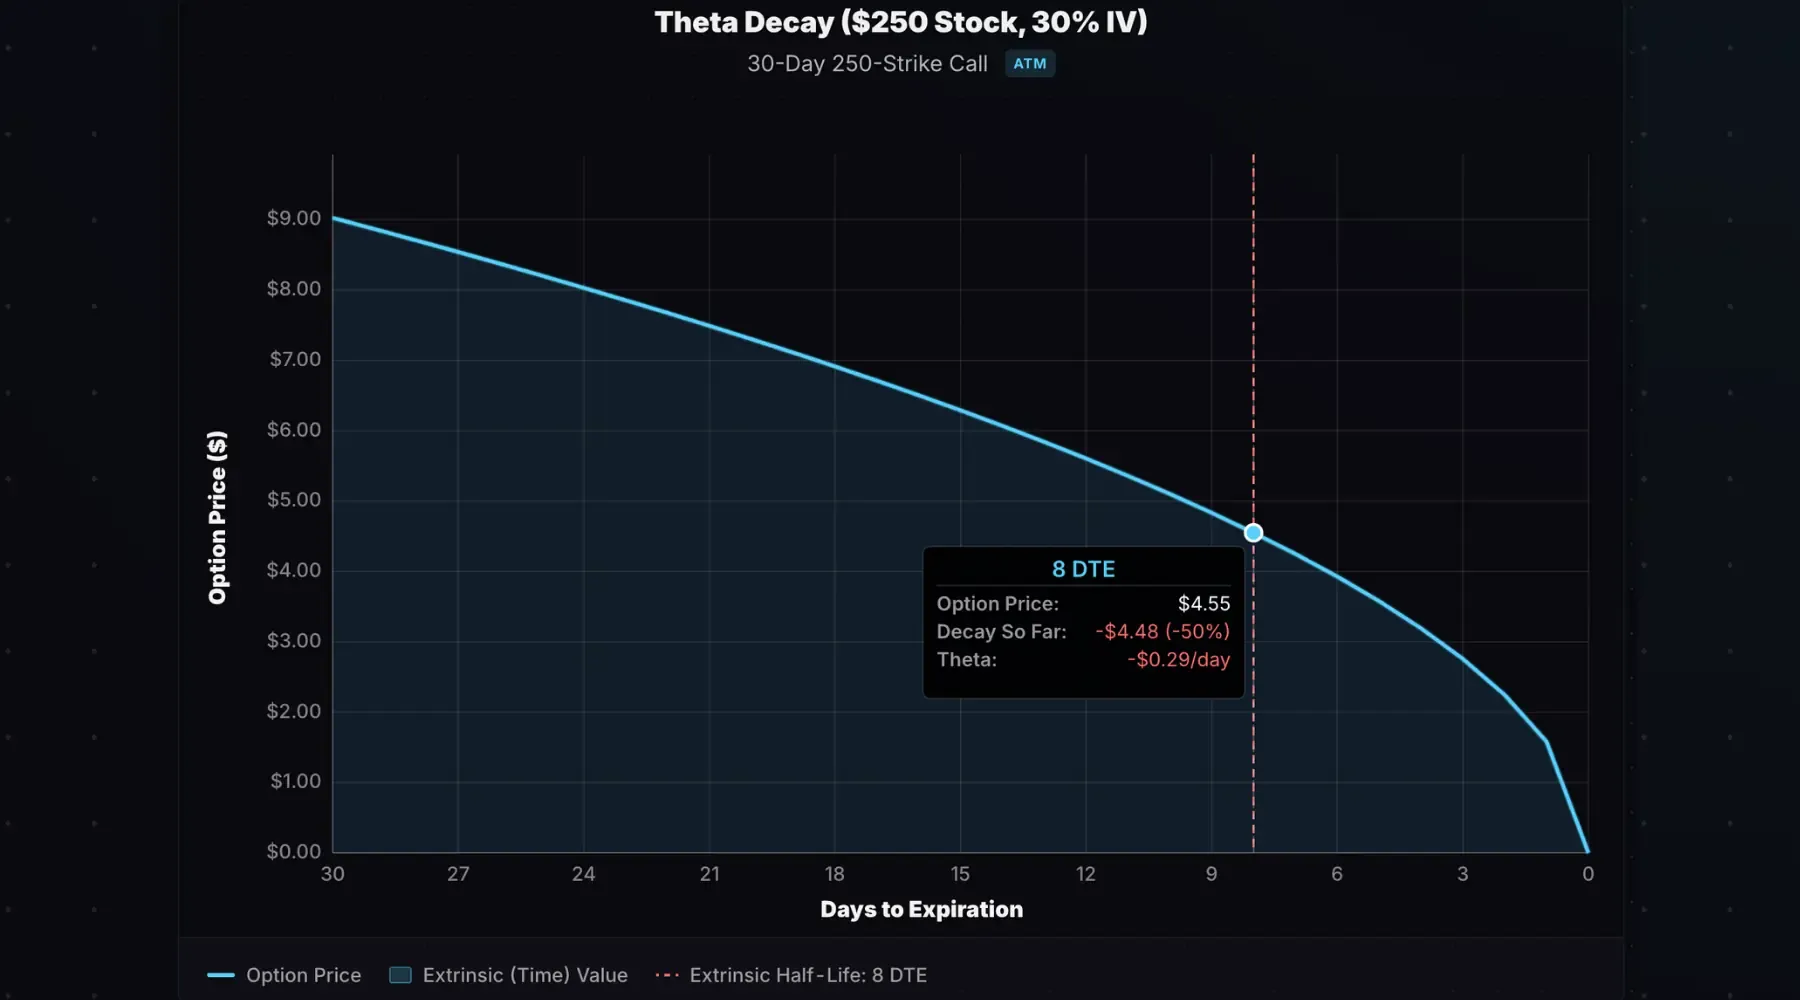
The call loses 50% of its value by 8 DTE, not 15 DTE. Our theta decay curve calculator shows “73% elapsed,” meaning this option loses half its value after 73% of the trade duration has passed. Decay is slower in the first half, and faster in the second.
This matters for long straddles because you’re buying ATM options on both sides. If the stock doesn’t move early in the trade, your losses are relatively small. But if it still hasn’t moved with a week left, theta accelerates and the position bleeds faster. Long straddles need movement, ideally early in the trade before theta decay erodes the position.
Implied Volatility Impact
Long straddles are long volatility trades. The position has positive vega: it benefits when implied volatility rises and suffers when IV falls.
The chart below shows the modeled impact of an immediate 5% IV increase on this IWM long straddle:
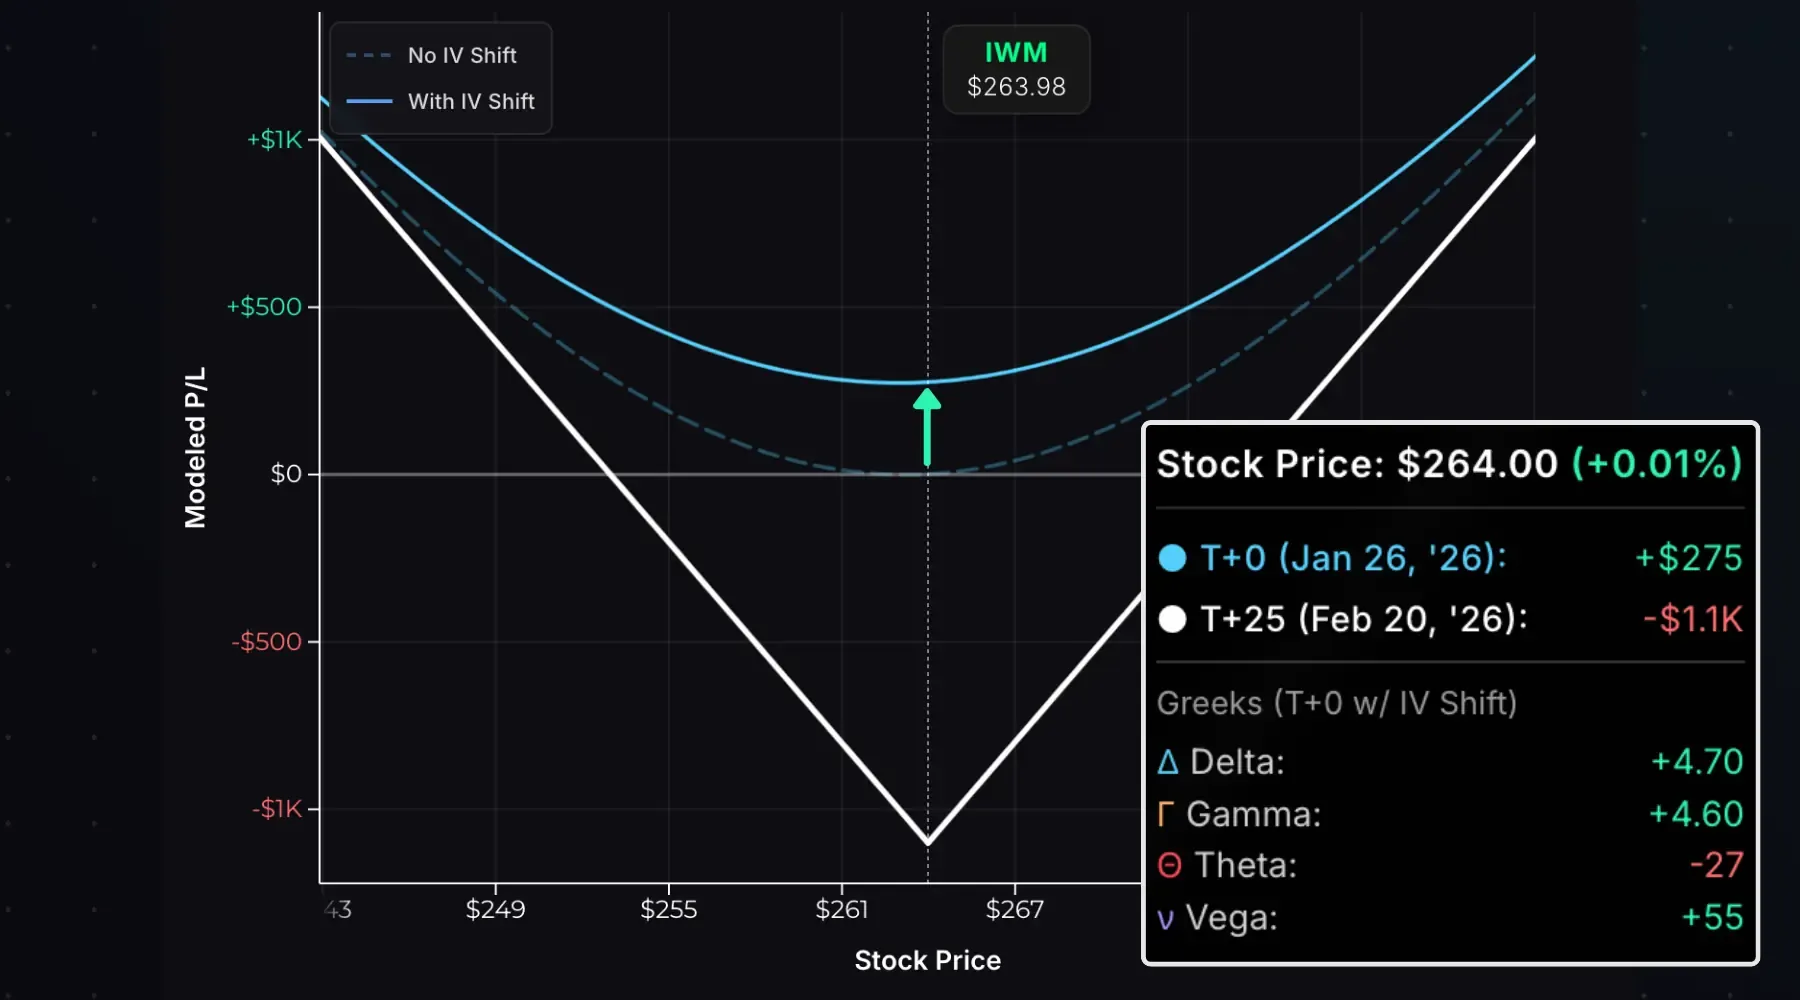
The dashed line is the original P/L curve at entry. The solid line shows P/L with +5% IV applied. The position gains $275 from the IV spike alone. For simplicity, this assumes the stock price is the same, and the IV increase occurs immediately after entry.
Here’s the math. Using a 264 stock price, 264 strike, 25 DTE, 5% risk-free rate, and 0% dividend yield:
| IV | Call Price | Put Price | Straddle Price |
|---|---|---|---|
| 25% | $7.34 | $6.43 | $13.77 |
| 30% | $8.71 | $7.81 | $16.52 |
Calculated using our Black-Scholes Options Pricing Calculator
If you bought the straddle at 25% IV and IV immediately spiked to 30%, the straddle price jumps from $13.77 to $16.52, an unrealized gain of $275.
A straddle’s price reflects the market’s expected move. Buying one is a bet that actual movement will be larger than implied volatility suggests. If the market prices in a bigger expected move after you buy, the straddle rises and you profit, even if the stock doesn’t move.
Buying Straddles Around Earnings
Some traders buy straddles before earnings announcements, betting the stock will move more than the options imply. This is high-risk.
Earnings reports are catalysts for large moves in either direction. Options in the “earnings expiration cycle,” the nearest expiration after the announcement, trade at elevated IV to reflect this uncertainty.
Example: SOFI October 2025 Earnings
SOFI reported earnings before the open on Tuesday, October 28th, 2025. The weekly options expiring Friday, October 31st (4 DTE), were trading around 143% IV:
| Oct 27 Close (Pre-Earnings) | Oct 28 Open (Post-Earnings) | |
|---|---|---|
| Stock Price | $30.00 | $30.99 |
| 30 Call | $1.83 | $1.77 |
| 30 Put | $1.73 | $0.63 |
| Straddle Price | $3.56 | $2.40 |
| IV | 143% | 103% |
SOFI gapped up $0.99 on the open after the earnings report. Despite the move higher, the straddle price fell from $3.56 to $2.40, a 33% loss. IV collapsed from 143% to 103%. This is the “IV crush” that occurs after a company’s earnings report.
The $0.99 earnings move wasn’t large enough to overcome the IV crush. The straddle was priced at $3.56, which means an earnings move smaller than $3.56 can lead to losses for a straddle buyer due to the IV crush.
Bottom line: Buying straddles into earnings is a bet that the stock will move more than the market expects. The elevated IV means you’re paying a premium for that bet.
Gamma vs DTE
At-the-money option gamma increases as expiration approaches, causing larger P/L swings for the same stock movement. For long straddles, this works in your favor.
The chart below shows gamma for a 150-strike call at 45, 10, and 1 DTE:
Near expiration, stock movements around the strike cause much larger P/L swings. For a long straddle, this means stock movements benefit you more, but if the stock stays near the strike, theta decay accelerates in the final days before expiration and your losses grow quickly.
Early Exercise
Both legs of a long straddle can be exercised at any time since you own the options. However, early exercise is rarely optimal.
Long Call Exercise: You buy 100 shares at the strike price. Only consider if the call is deep ITM with essentially no extrinsic value remaining, or to capture a dividend.
Long Put Exercise: You sell 100 shares at the strike price. Only consider if the put is deep ITM with essentially no extrinsic value remaining.
In practice, selling the options is almost always better than exercising because you capture any remaining extrinsic value. The only exception is deep ITM options near expiration with wide bid-ask spreads where exercising avoids slippage, or when capturing a dividend.
Entry, Exit, and Expiration
To enter: Buy an ATM call and ATM put at the same strike and expiration. You’ll pay a debit.
To exit before expiration: Sell both options in a single order. You’ll receive a credit. Profit = credit received − debit paid.
At expiration, using a 100 straddle bought for $5:
| Scenario | Stock Price | Result |
|---|---|---|
| At Strike | Exactly at strike | Both options expire worthless. Max loss. |
| Within Breakevens | Between $95–$105 | One option ITM with value, one expires. Partial loss. |
| Beyond Breakevens | < $95 or > $105 | One option deep ITM. Profit. |
If the straddle is held through expiration:
- Stock at $100: Both options expire worthless. You lose the $500 debit.
- Stock at $103: Put expires, call is worth $3. Net loss: $500 − $300 = $200.
- Stock at $120: Call is worth $20. Profit: $2,000 − $500 debit = $1,500.
- Stock at $85: Put is worth $15. Profit: $1,500 − $500 debit = $1,000.
Long Straddle vs Short Straddle
A short straddle is selling a straddle: you sell an ATM call and put instead of buying them.
| Long Straddle | Short Straddle | |
|---|---|---|
| Entry | Debit | Credit |
| Max Profit | Unlimited | Limited (premium received) |
| Max Loss | Limited (premium paid) | Unlimited |
| Profits When | Stock moves significantly | Stock stays near strike |
| Volatility Exposure | Long (benefits from rising IV) | Short (benefits from falling IV) |
| Theta | Negative (time hurts) | Positive (time helps) |
Use a long straddle when you expect a big move but aren’t sure which direction. Use a short straddle when you expect the stock to stay in a tight band and IV to fall.
Long Straddle vs Long Strangle
A long strangle also buys a call and put, but at different strikes, typically OTM on both sides.
| Long Straddle | Long Strangle | |
|---|---|---|
| Strikes | Same (ATM) | Different (OTM call, OTM put) |
| Premium Paid | Higher | Lower |
| Breakevens | Closer to stock price | Further from stock price |
| Max Loss | Higher | Lower |
| Gamma/Vega Exposure | Higher | Lower |
Example: Stock at $100.
- Long straddle for $10: Buy 100 call, buy 100 put → breakevens at $90 and $110
- Long strangle for $2: Buy 110 call, buy 90 put → breakevens at $88 and $112
The strangle costs less but requires a bigger move to profit. It’s a cheaper bet on volatility, but the stock needs to move further. Model both with our Straddle Calculator and Strangle Calculator.
Long Straddle vs Long Iron Butterfly
A long iron butterfly is the opposite of a short iron butterfly: you buy the ATM straddle and sell OTM wings to reduce cost.
| Long Straddle | Long Iron Butterfly | |
|---|---|---|
| Cost | Higher | Lower (short wings reduce debit) |
| Max Profit | Unlimited | Limited (wing width − debit) |
| Max Loss | Total debit | Total debit (but smaller) |
| Breakevens | Wider | Narrower |
Example: Stock at $100.
- Long straddle: Buy 100 call, buy 100 put, $10 debit
- Long iron butterfly: Buy 100 call, buy 100 put, sell 110 call, sell 90 put, $5 debit
The iron butterfly costs less but caps your upside. Use it when you expect a moderate move in either direction. Model it with our Iron Butterfly Calculator.
- A long straddle buys an ATM call and ATM put at the same strike and expiration, paying a debit.
- Max loss equals the total premium paid; max profit is unlimited to the upside and substantial on the downside.
- The position begins delta-neutral. It has low P/L sensitivity to small stock movements.
- Long straddles are positive gamma, positive vega, and negative theta. They profit from large moves and rising IV, but lose money from time decay.
- Time decay accelerates near expiration: if the stock hasn’t moved, the position bleeds faster in the final days.
- Buying straddles as earnings trades requires the stock to move more than the expected move to overcome the IV crush.
- Compared to a long strangle, the straddle costs more but has closer breakevens.
Related Guides
- What Is a Short Straddle?: Sell a straddle instead of buying it
- What Is Theta?: Understanding time decay
- What Is Gamma?: How stock movements help long premium positions
- What Is Vega?: How volatility affects option prices
- What Is Implied Volatility?: The key input driving straddle prices
Ready to model your own straddles? Use our Straddle Calculator to visualize P/L for any long straddle position.