What Is a Short Call?
Short call options explained visually: payoff diagrams, Greeks tables, and examples showing how the strategy works.
A short call is the sale of a call option, which profits when the stock stays below the strike price over time. You collect a premium at entry, keeping the full premium if the stock closes at or below the strike at expiration. If the stock rises above the strike, losses can grow indefinitely, and you may be assigned short stock at the strike price.
Short calls are rarely traded naked (without owning the underlying shares) due to the unlimited risk profile. Most traders sell calls as part of a covered call or bear call spread. But understanding the naked short call is essential, as it’s the building block for those strategies.
Short Call Example
If a stock is at $100, a short call would be:
- Sell one 105 call for $4.00
- Total Credit: $4.00
The call makes money as long as the stock stays below $109 (strike + premium). Maximum profit of $400 occurs if the stock closes at or below $105 at expiration: the call expires worthless and you keep the entire premium.
Payoff Diagram
The short call payoff is flat below the strike and slopes downward above it:
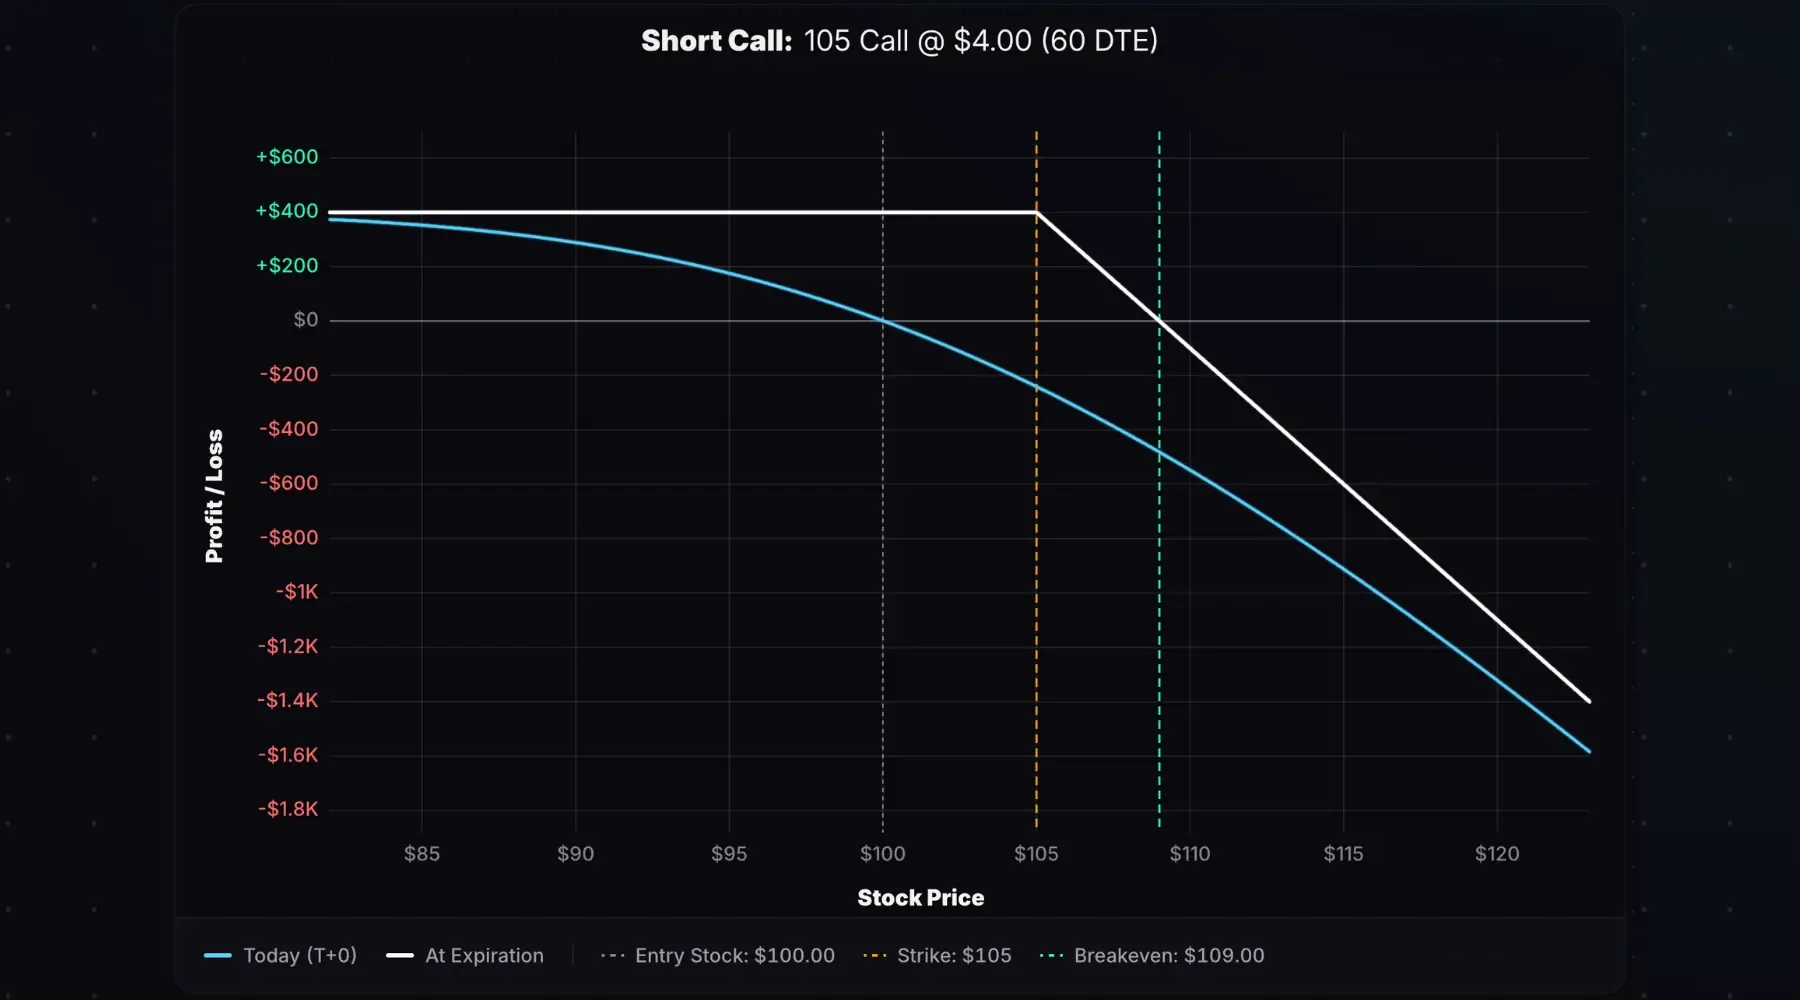
Stock at Entry: $100. Trade: Short 105 call for $4.00 credit. 60 days to expiration (DTE).
The white line shows the payoff at expiration. The maximum profit of $400 occurs if the stock closes at or below the $105 strike. Above $105, profits shrink until reaching the $109 breakeven. Beyond that, losses grow indefinitely as the stock rises.
The cyan line (T+0) shows the modeled payoff at entry. The gap between the two lines represents time decay yet to be captured.
Key Characteristics
- Max Profit: Premium received × 100. Occurs if the stock closes at or below the strike at expiration.
- Max Loss: Unlimited. The stock can rise indefinitely.
- Breakeven: Strike price + premium received
- Outlook: Bearish to neutral
Here are the metrics for a 105-strike call sold for $4.00:
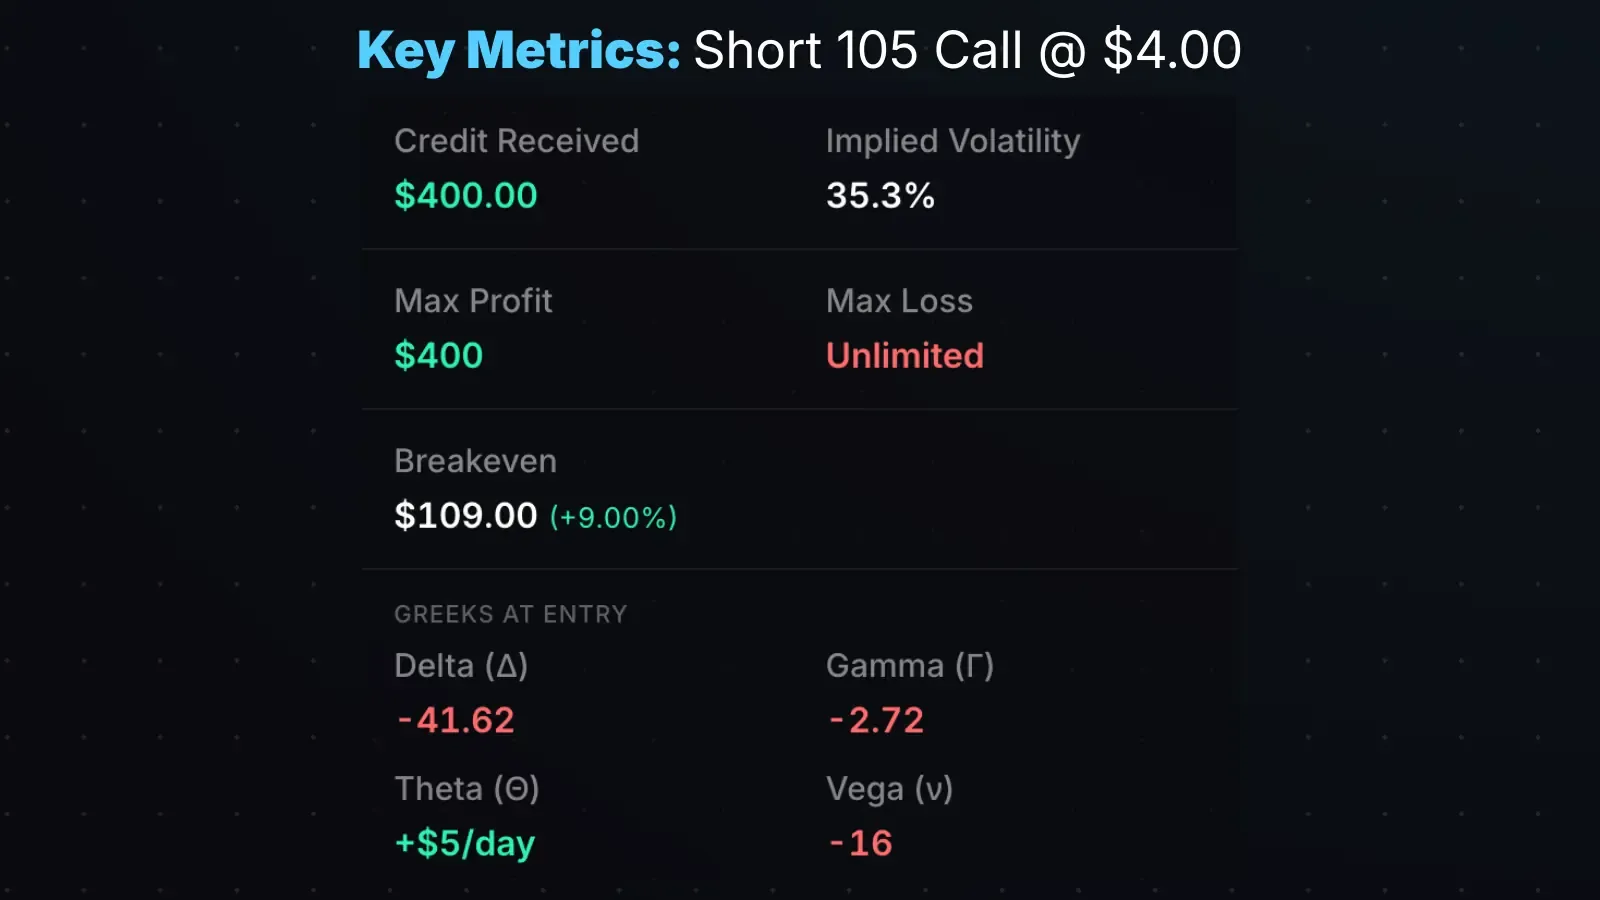
The breakeven of $109 gives the stock 9% room to rise before the trade loses money. But unlike defined-risk strategies, there’s no cap on losses, and a sharp rally can result in catastrophe.
This unlimited risk profile is why brokers require significant margin to hold naked short calls. The margin requirement often exceeds the premium received by 5–10x or more.
How the Greeks Affect a Short Call
A short call has negative delta, negative gamma, positive theta, and negative vega.
| Greek | Exposure | What It Means |
|---|---|---|
| Delta (Δ) | Negative | Profits when the stock falls |
| Gamma (Γ) | Negative | Delta shifts against you as the stock rises |
| Theta (Θ) | Positive | Time decay benefits the position |
| Vega (ν) | Negative | Rising IV hurts; falling IV helps |
Here’s a short 85 call on NFLX sold for $3.90 with 52 DTE. The stock is at $84.35, just below the strike:
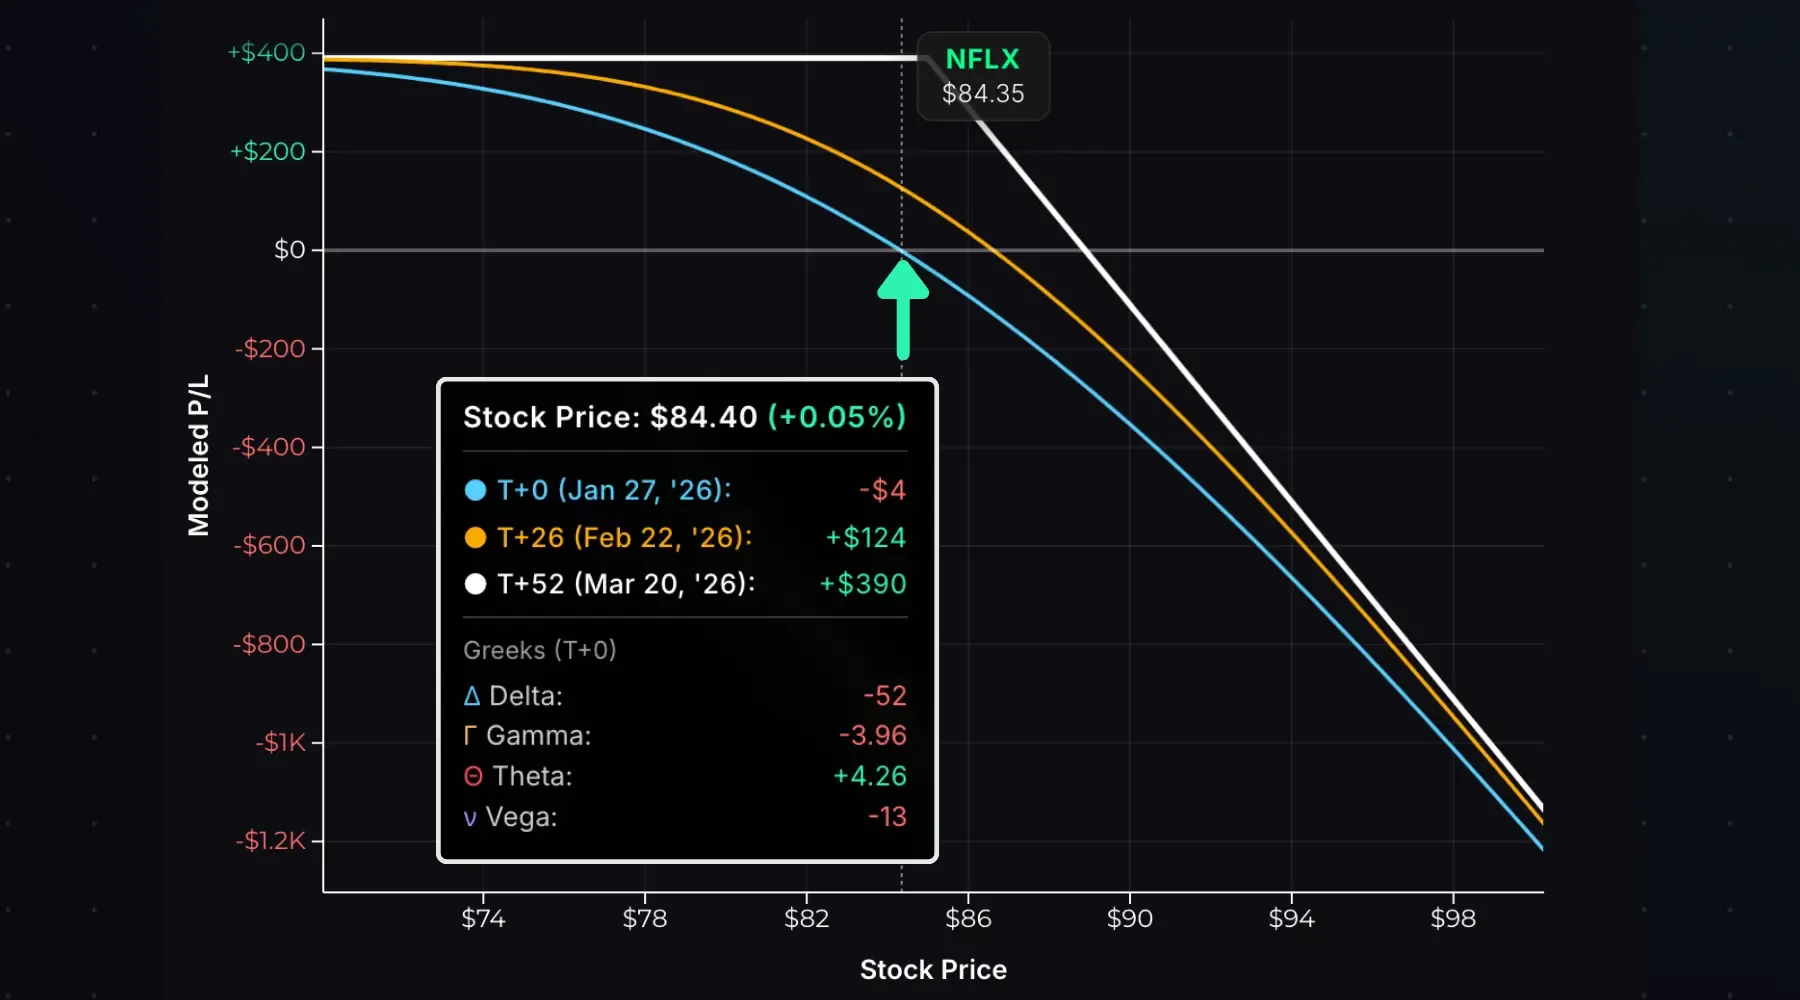
At entry, delta is -52, so the position loses roughly $52 for every $1 increase in NFLX. Theta is +4.26, meaning the position earns about $4.26 per day from time decay if NFLX stays flat.
If the stock drops to $75, the call moves far OTM:
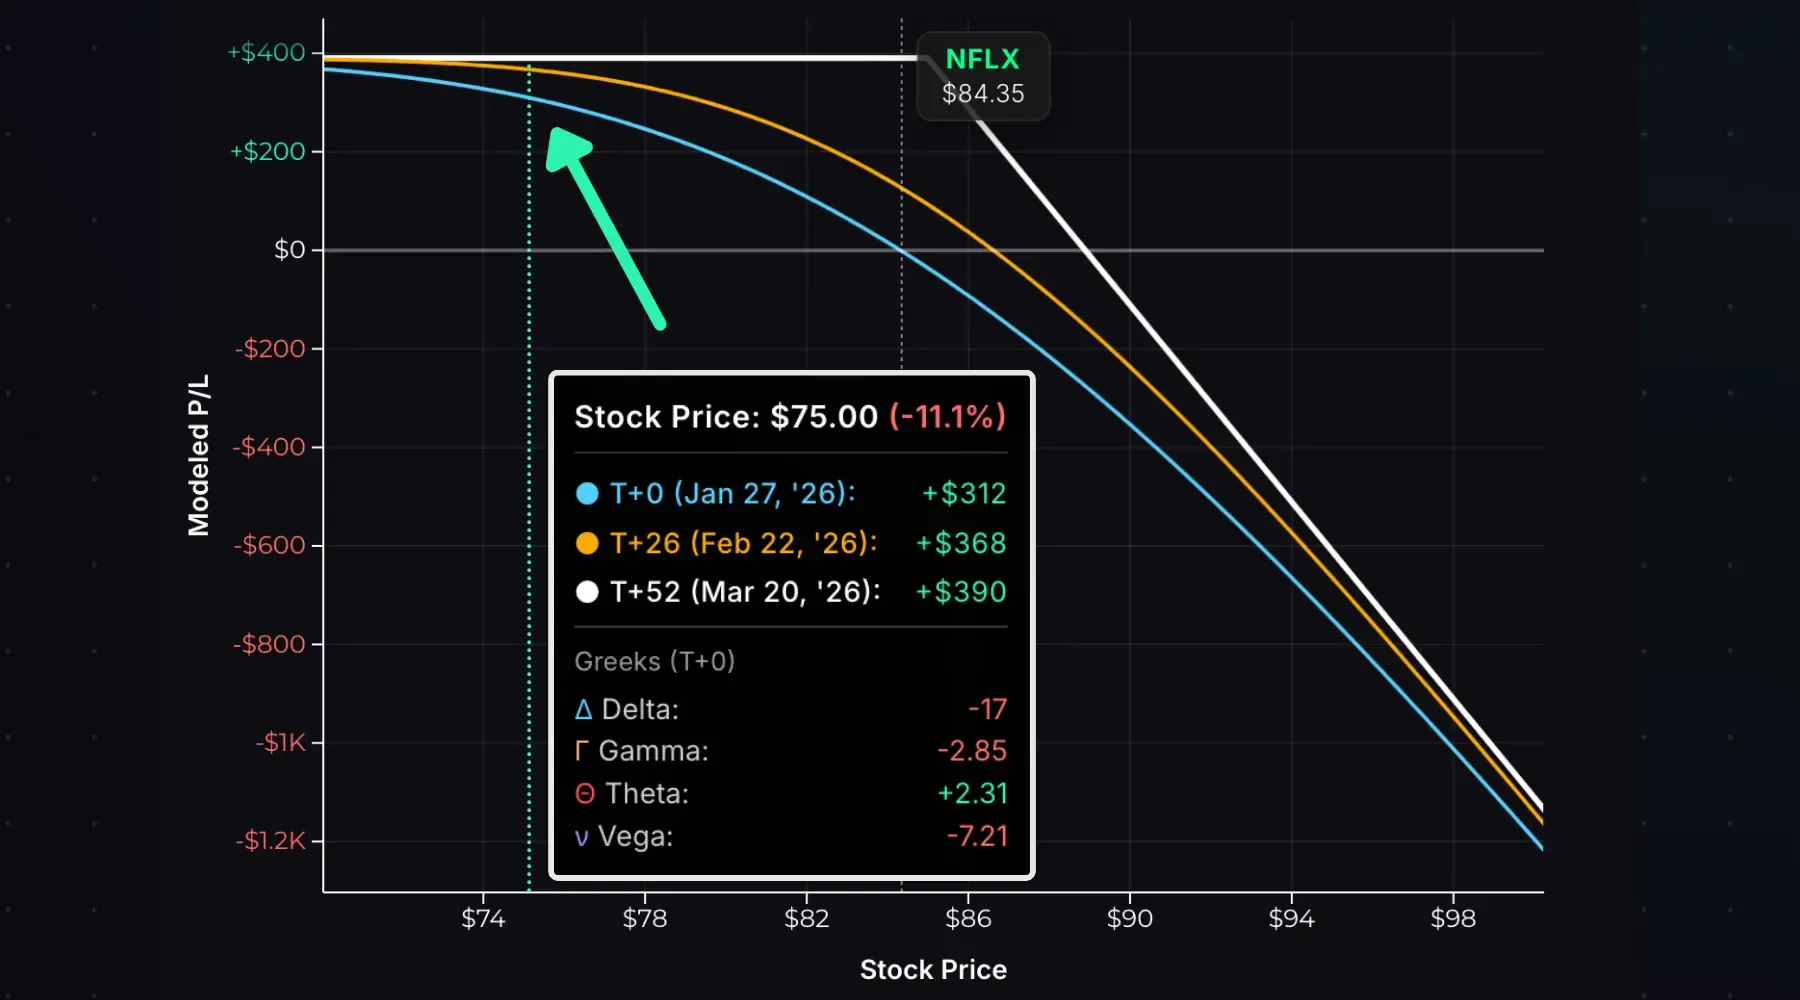
The T+0 P/L shows +$312, nearly at the $390 max profit with the stock 11% below entry. Delta shrinks to -17 and theta drops to +2.31. The position is less sensitive to all variables, but has little value left to capture.
Now consider a rally to $95:
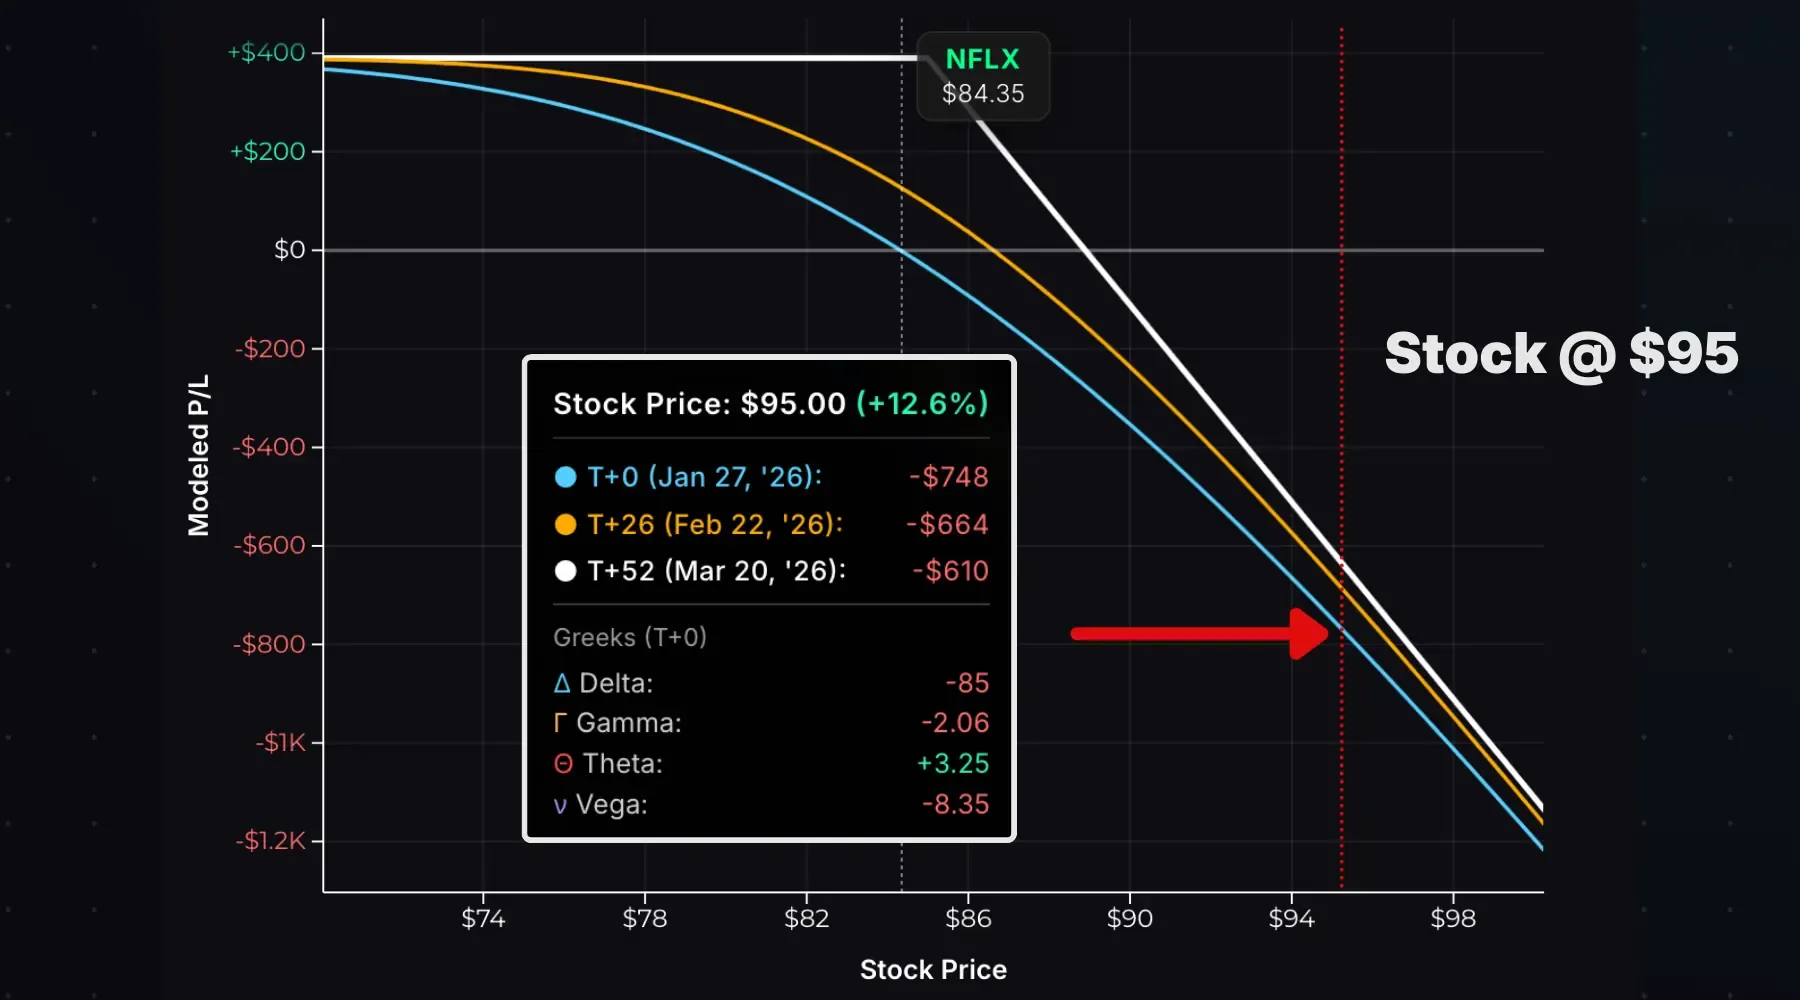
Delta balloons to -85 and the T+0 P/L shows -$748. At expiration, the loss would be -$610, slightly better since the call has less extrinsic value, but the difference is small because the option is now mostly intrinsic. As the stock continues rising, delta approaches -100. The short call behaves like short stock, losing $100 per $1 move.
This is negative gamma in action. Delta accelerates against you as the stock runs.
Time Decay Impact
Time decay is a profit driver for a short call. As expiration approaches, if the stock stays below the strike, the call’s extrinsic value erodes, allowing you to buy it back cheaper or let it expire worthless.
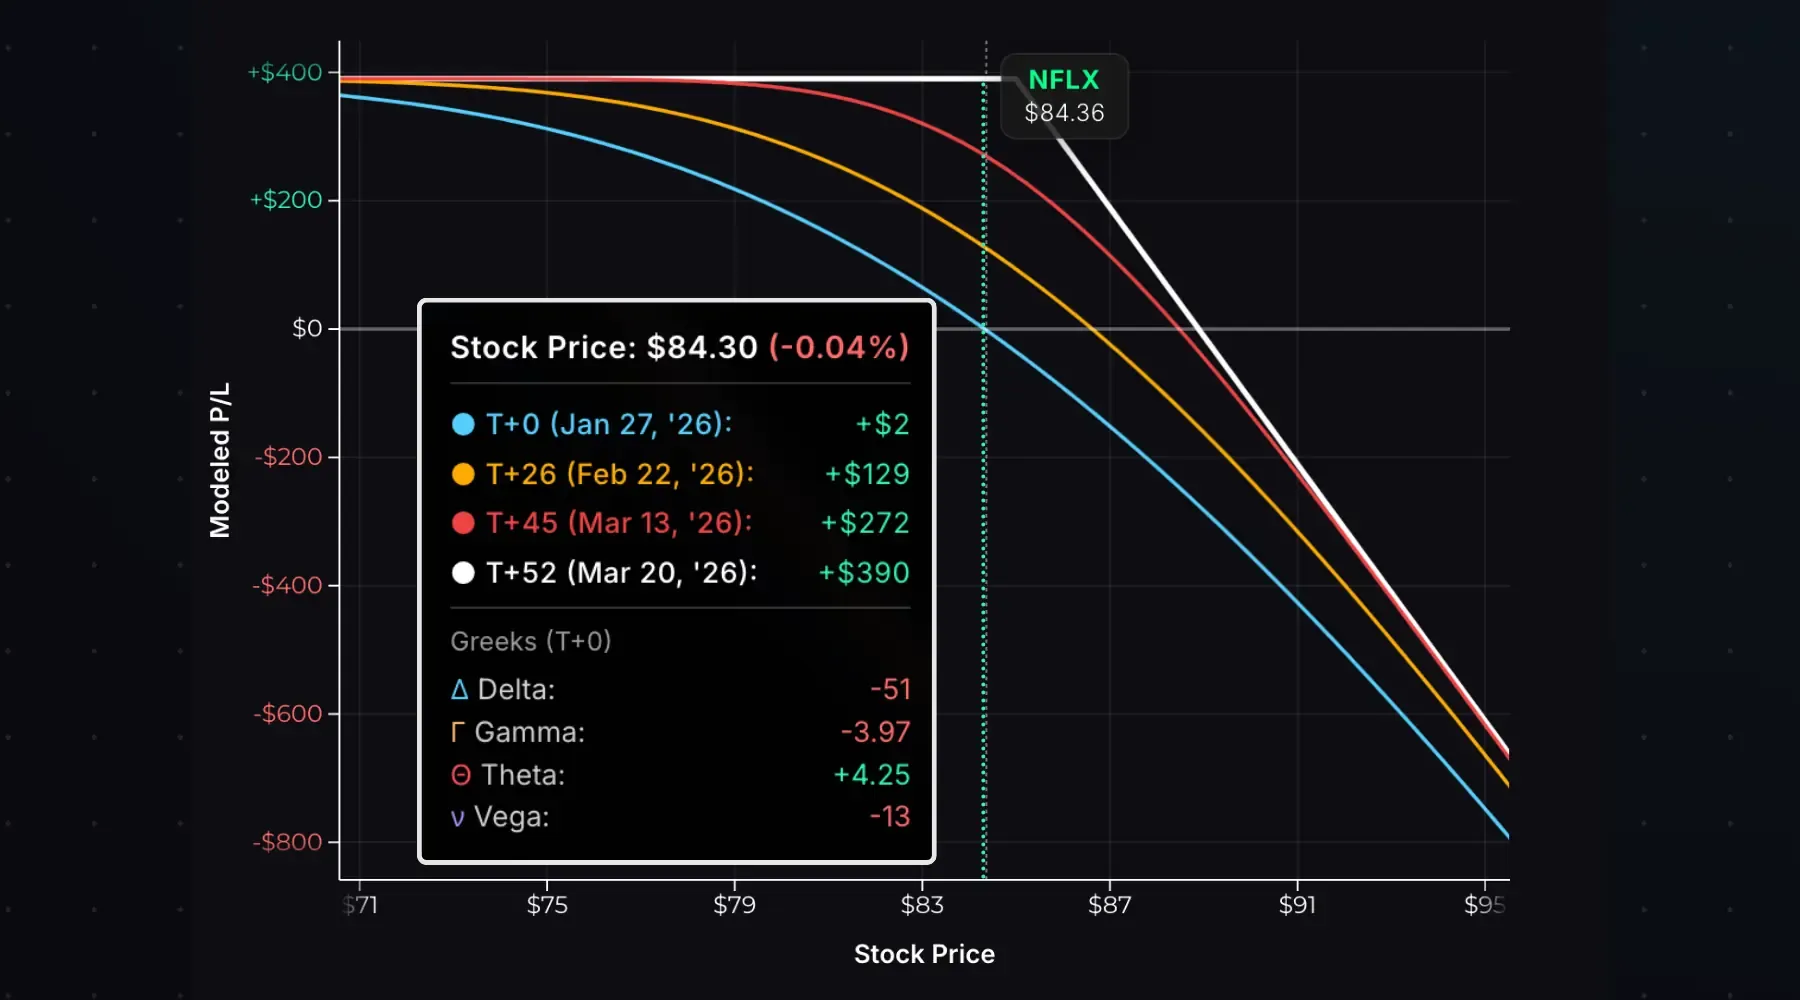
The chart below shows how P/L evolves over time with NFLX at $84.30, just under the $85 strike:
| Time | P/L |
|---|---|
| T+0 (Entry) | $0 |
| T+26 | +$129 |
| T+45 | +$272 |
| T+52 (Expiration) | +$390 |
With the stock just below the strike, the call steadily decays. By T+26 (halfway to expiration), you’ve captured 33% of max profit. By T+45, you’re at 70%. Many traders close at 50–75% of max profit rather than waiting for expiration; more on that in the exit section.
ATM Theta Decay Curve
The NFLX call was nearly ATM. ATM options decay slowly early, then accelerate into expiration. The chart below shows a 45-day 100 call on a $100 stock with 30% IV, assuming the stock stays pinned:
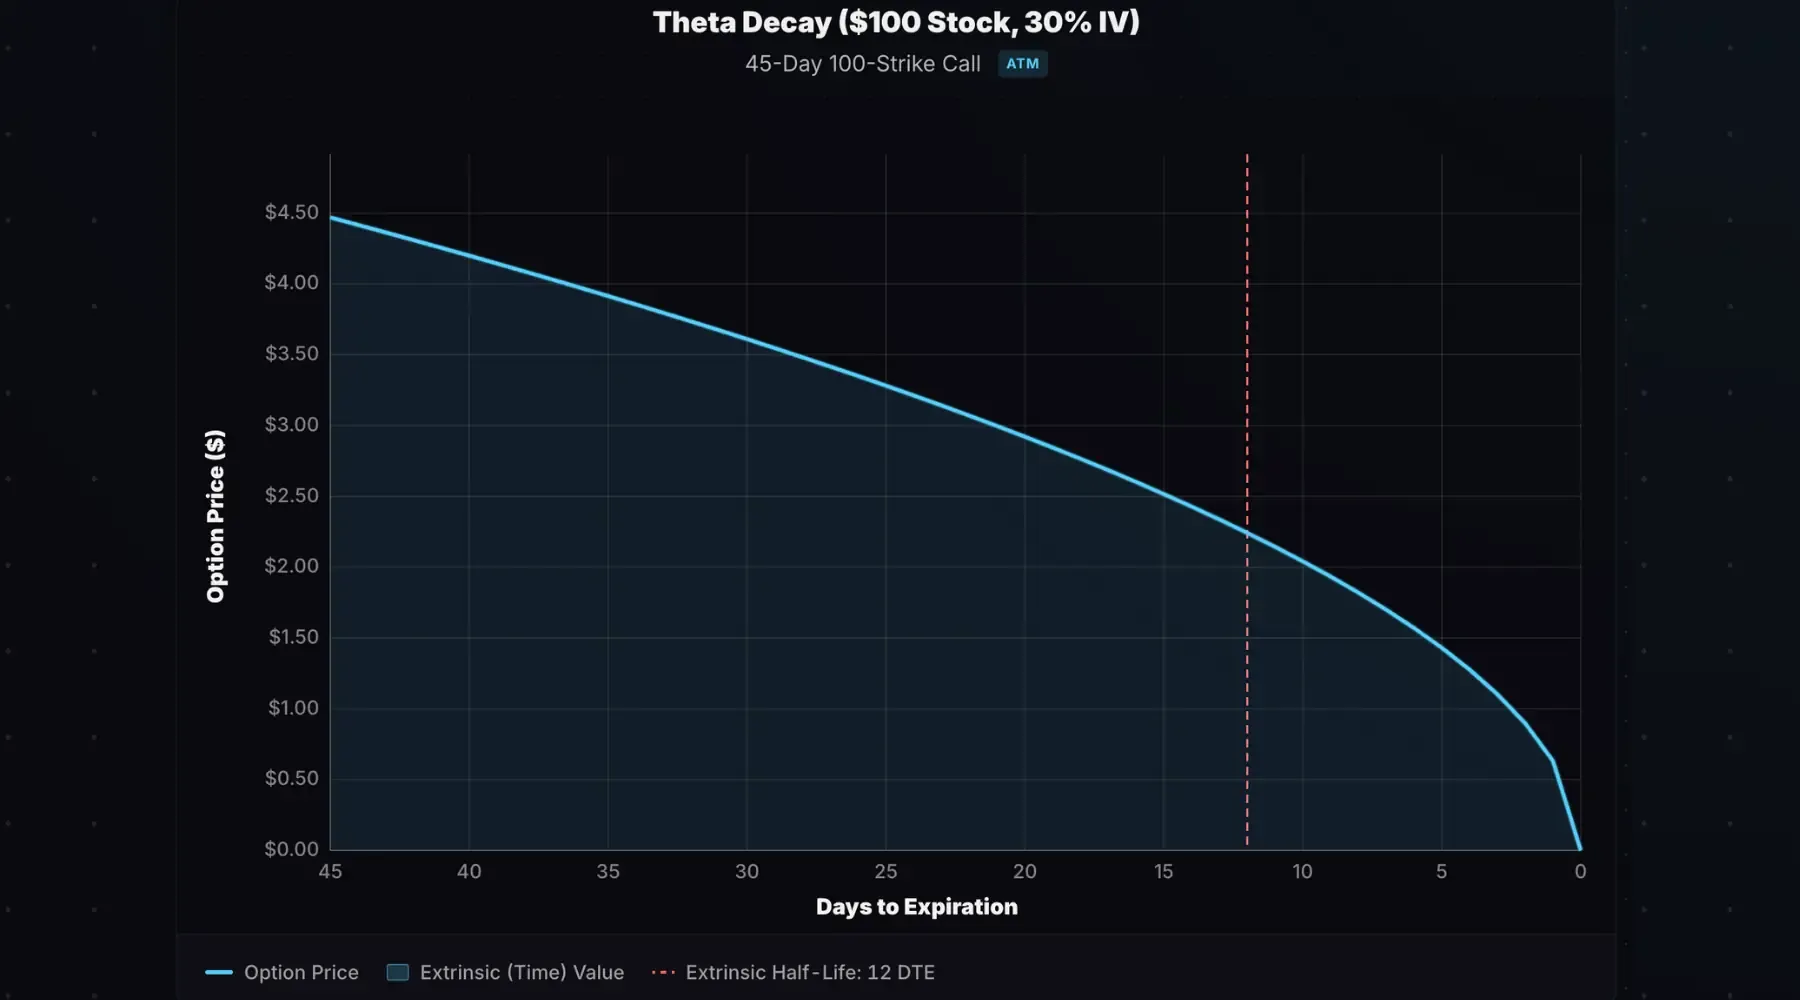
When selling ATM calls, or strikes close to the stock price, profits depend more on the stock price falling than on time decay alone.
OTM Theta Decay Curve
OTM options decay faster on a percentage basis than ATM options. The chart below is the same setup, except a 110-strike OTM call:
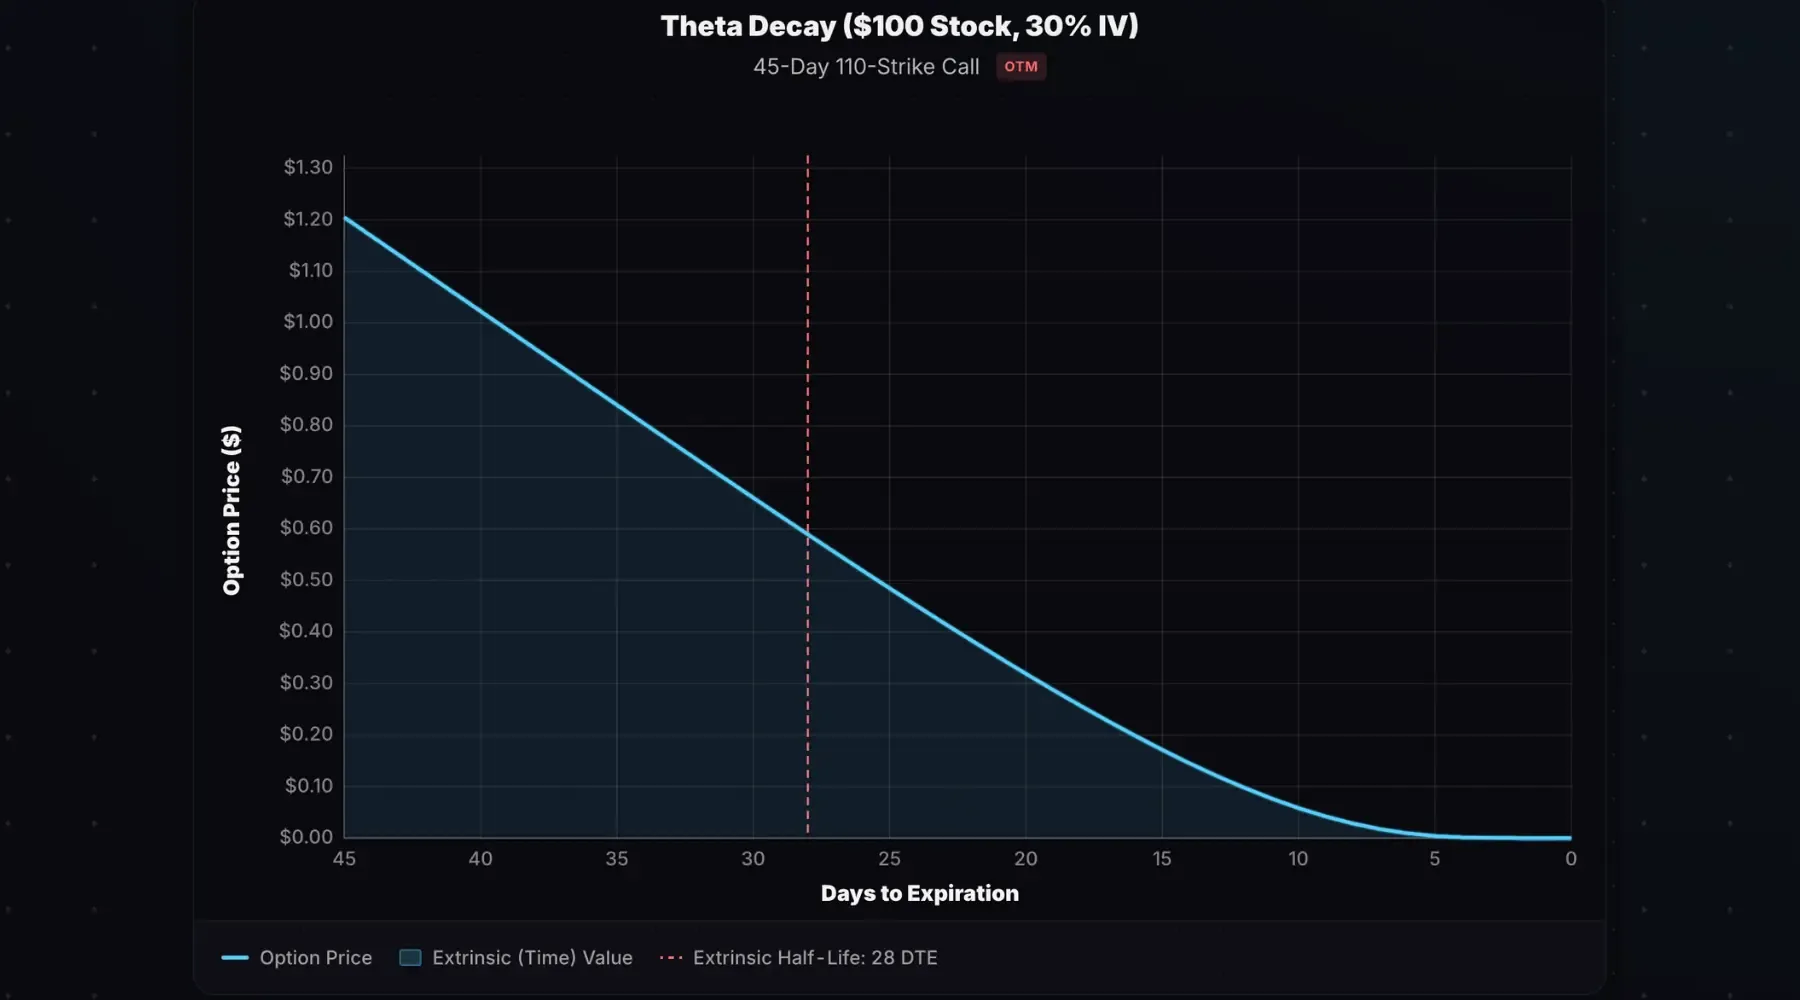
The call loses half its value by 28 DTE and nearly all of it by 5 DTE. This front-loaded decay benefits OTM short call sellers, as you capture most of your profit well before expiration.
Model decay curves like these with the theta decay curve calculator.
Implied Volatility Impact
Short calls are short volatility. The position has negative vega, so it profits when implied volatility falls and loses when IV rises.
The chart below shows the impact of an immediate 10% IV increase on the NFLX short call:
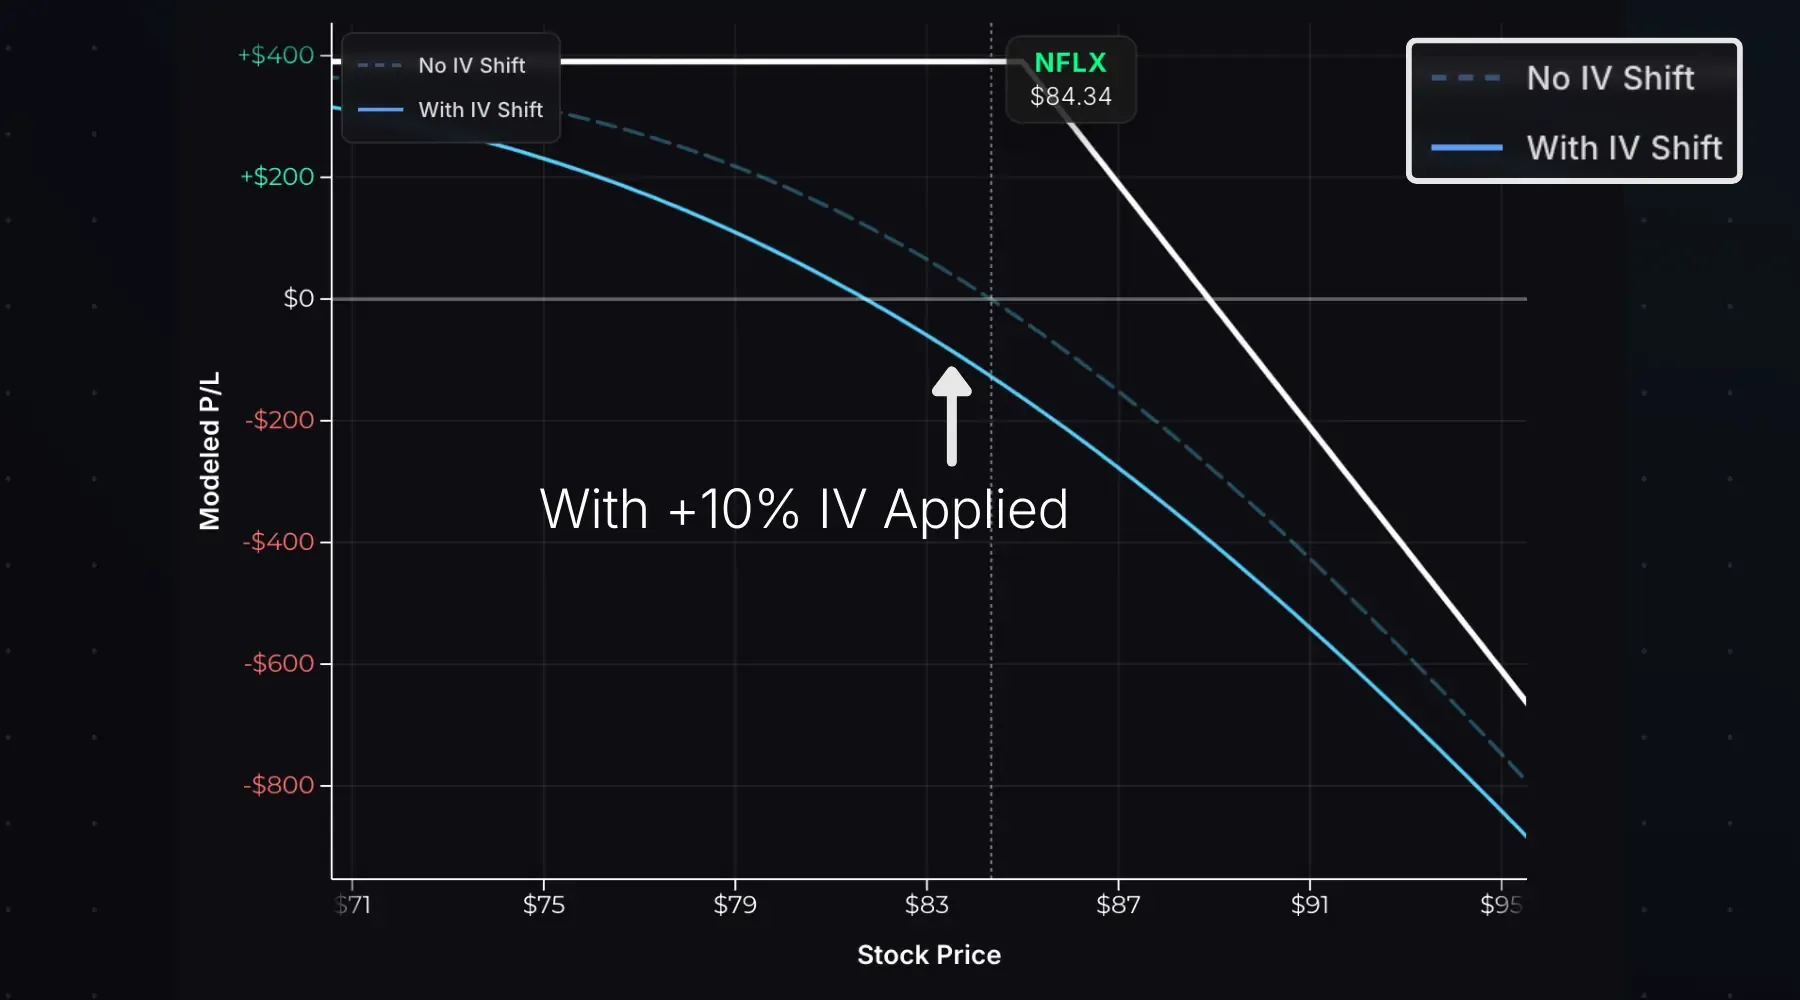
The dashed line is the original T+0 P/L curve. The solid line shows projected P/L with +10% IV. The entire curve shifts down, and the position is less profitable at every stock price. Higher IV means higher call prices, which hurts when you’re short.
Selling calls is most attractive when IV is elevated. You collect more premium, and if IV contracts, you benefit from both time decay and the volatility decline. Selling calls into low IV environments offers less premium and more risk if volatility spikes.
Strike Selection
Strike selection determines your premium, probability of profit, and risk exposure.
Consider a $100 stock with 45-day options at 30% IV:
| Strike | Delta | Premium | Breakeven | Prob. OTM |
|---|---|---|---|---|
| 100 (ATM) | -54 | $4.50 | $104.50 | ~46% |
| 105 (OTM) | -36 | $2.46 | $107.46 | ~64% |
| 110 (OTM) | -21 | $1.22 | $111.22 | ~79% |
ATM strikes collect more premium but have a lower probability of expiring worthless. OTM strikes collect less premium but give the stock more room to rise.
Delta’s primary use is gauging directional risk, but it also approximates the probability of the option expiring ITM. A 36-delta call has roughly a 36% chance of finishing ITM, meaning a 64% chance of expiring worthless.
Entry, Exit, and Expiration
To enter: Sell-to-open (STO) a call. You receive a credit immediately. You’ll need available capital to cover the margin requirement, often $5,000+ for a single contract.
To exit before expiration: Buy-to-close (BTC) the call. You pay a debit. Profit = credit received − debit paid.
Profit target: Many traders close at 50–75% of max profit. If you sold a call for $5.00 and it’s now worth $1.50, you’ve captured $3.50 (70%) of the potential profit. Closing early removes the risk of a late reversal erasing your gains.
Expiration scenarios for a 105 call sold for $4.00:
| Stock at Expiration | Result |
|---|---|
| $100 (below strike) | Call expires worthless. Keep full $400 credit. |
| $107 (within breakeven) | Call $2 ITM. Assigned, sell shares at $105. Net profit: $200. |
| $120 (beyond breakeven) | Call $15 ITM. Assigned, sell shares at $105. Net loss: $1,100. |
If you don’t own shares and the call is assigned, you’ll be short 100 shares at the strike price. You must buy to cover the short position at whatever the current market price is.
Dividend Risk and Early Assignment
Short calls carry early assignment risk, especially around ex-dividend dates.
If you’re short an ITM call and the stock goes ex-dividend tomorrow, the call holder may exercise early to capture the dividend. This happens when the call’s extrinsic value is less than the dividend amount, so exercising becomes more profitable than selling the call.
Example: Stock at $110, and the short 105 call is worth $5.50 ($5.00 intrinsic + $0.50 extrinsic). The dividend is $0.75. Since $0.75 > $0.50, early exercise is likely, as the call holder captures more value by exercising the option and collecting the dividend.
If assigned, you’re obligated to sell 100 shares at the strike price. If you don’t own shares, you’ll be short stock and owe the dividend to the shareholder.
To manage dividend risk: Monitor ITM short calls as ex-dividend dates approach. If extrinsic value drops below the dividend, close the position or accept likely assignment.
Short Call vs Covered Call
A covered call is a short call with stock ownership: you sell a call against shares you already hold.
| Naked Short Call | Covered Call | |
|---|---|---|
| Stock Position | None | Own 100 shares |
| Max Profit | Premium received | (Strike − stock cost basis) + premium |
| Max Loss | Unlimited | Stock cost basis − premium (if stock → $0) |
| Assignment Result | Short stock position | Shares called away (max profit) |
| Use When | You’re bearish and accept unlimited risk | You own shares and are willing to sell at the strike |
The covered call eliminates upside risk entirely. If the stock rallies, your shares are called away at the strike, realizing the max profit. The naked short call has no such protection.
Short Call vs Long Put
Both strategies profit when the stock falls, but the risk profiles differ.
| Short Call | Long Put | |
|---|---|---|
| Entry | Credit | Debit |
| Max Profit | Limited (premium received) | Substantial (strike − premium, if stock → $0) |
| Max Loss | Unlimited | Limited (premium paid) |
| Theta | Positive (time helps) | Negative (time hurts) |
| Vega | Negative (falling IV helps) | Positive (rising IV helps) |
| Use When | Neutral-to-bearish, elevated IV | Strongly bearish |
If you expect a modest decline or sideways action, the short call profits from time decay without needing the stock to move. If you expect a sharp drop, the long put offers unlimited profit potential with defined risk.
Short Call vs Bear Call Spread
A bear call spread adds a long call above the short call, defining your risk.
| Short Call | Bear Call Spread | |
|---|---|---|
| Risk | Unlimited | Defined (spread width − credit) |
| Max Profit | Higher | Lower (long call reduces credit) |
| Max Loss | Unlimited | Capped |
| Margin Required | High | Lower |
| Breakeven | Same | Same |
Example: Stock at $100.
- Short call: Sell 105 call for $4.00 → max profit $400, unlimited risk
- Bear call spread: Sell 105 call, buy 115 call for $2.50 net credit → max profit $250, max loss $750
The bear call spread sacrifices $150 of profit potential to cap the max loss at $750. For most traders, this tradeoff makes sense, as unlimited risk is rarely worth the extra premium.
- A short call sells the obligation to deliver shares at the strike price, collecting premium upfront.
- Max profit equals the premium received; max loss is unlimited as the stock can rise indefinitely.
- Positive theta and negative vega: the position profits from time decay and falling IV.
- Early assignment risk increases near ex-dividend dates when the call is ITM and extrinsic value is less than the dividend.
- Naked short calls carry unlimited risk and high margin requirements. Consider a covered call or bear call spread for defined risk.
Related Resources
- Short Call Calculator: Visualize P/L and Greeks for any short call
- What Is a Covered Call?: Short call with stock ownership
- What Is a Bear Call Spread?: Add a long call to define your risk
- What Is a Long Put?: Bearish alternative with defined risk
- What Is a Long Call?: Buy a call instead of selling one
- What Is Theta?: Understanding time decay
- What Is Implied Volatility?: Why IV matters for short premium trades