What Is Delta in Options Trading?
Learn what delta means in options trading, how to interpret delta values for calls and puts, and how traders use position delta to measure directional risk.
Delta is one of the option “Greeks,” risk measures options traders use to understand how their positions behave. Delta tells you how much an option’s price is expected to change when the stock price moves $1.
A call option with a delta of 0.50 should gain $0.50 if the stock rises $1. A put option with a delta of −0.30 should gain $0.30 if the stock falls $1.
Options traders use delta in two important ways: measuring directional risk in dollar terms, and estimating an option’s probability of expiring in-the-money.
Call Delta vs Put Delta
Call Options Have Positive Delta
Call options increase in value when the stock price rises and decrease when it falls. A call’s delta ranges from 0 to +1.0.
- Delta near 0: A deep out-of-the-money call. The stock price barely affects it.
- Delta near 0.50: An at-the-money call. The option price is half as sensitive to changes in the stock price (stock up $1, call up $0.50).
- Delta near 1.0: A deep in-the-money call. It moves dollar-for-dollar with the stock.
Here’s the P/L curve for a 185-strike NVDA call:
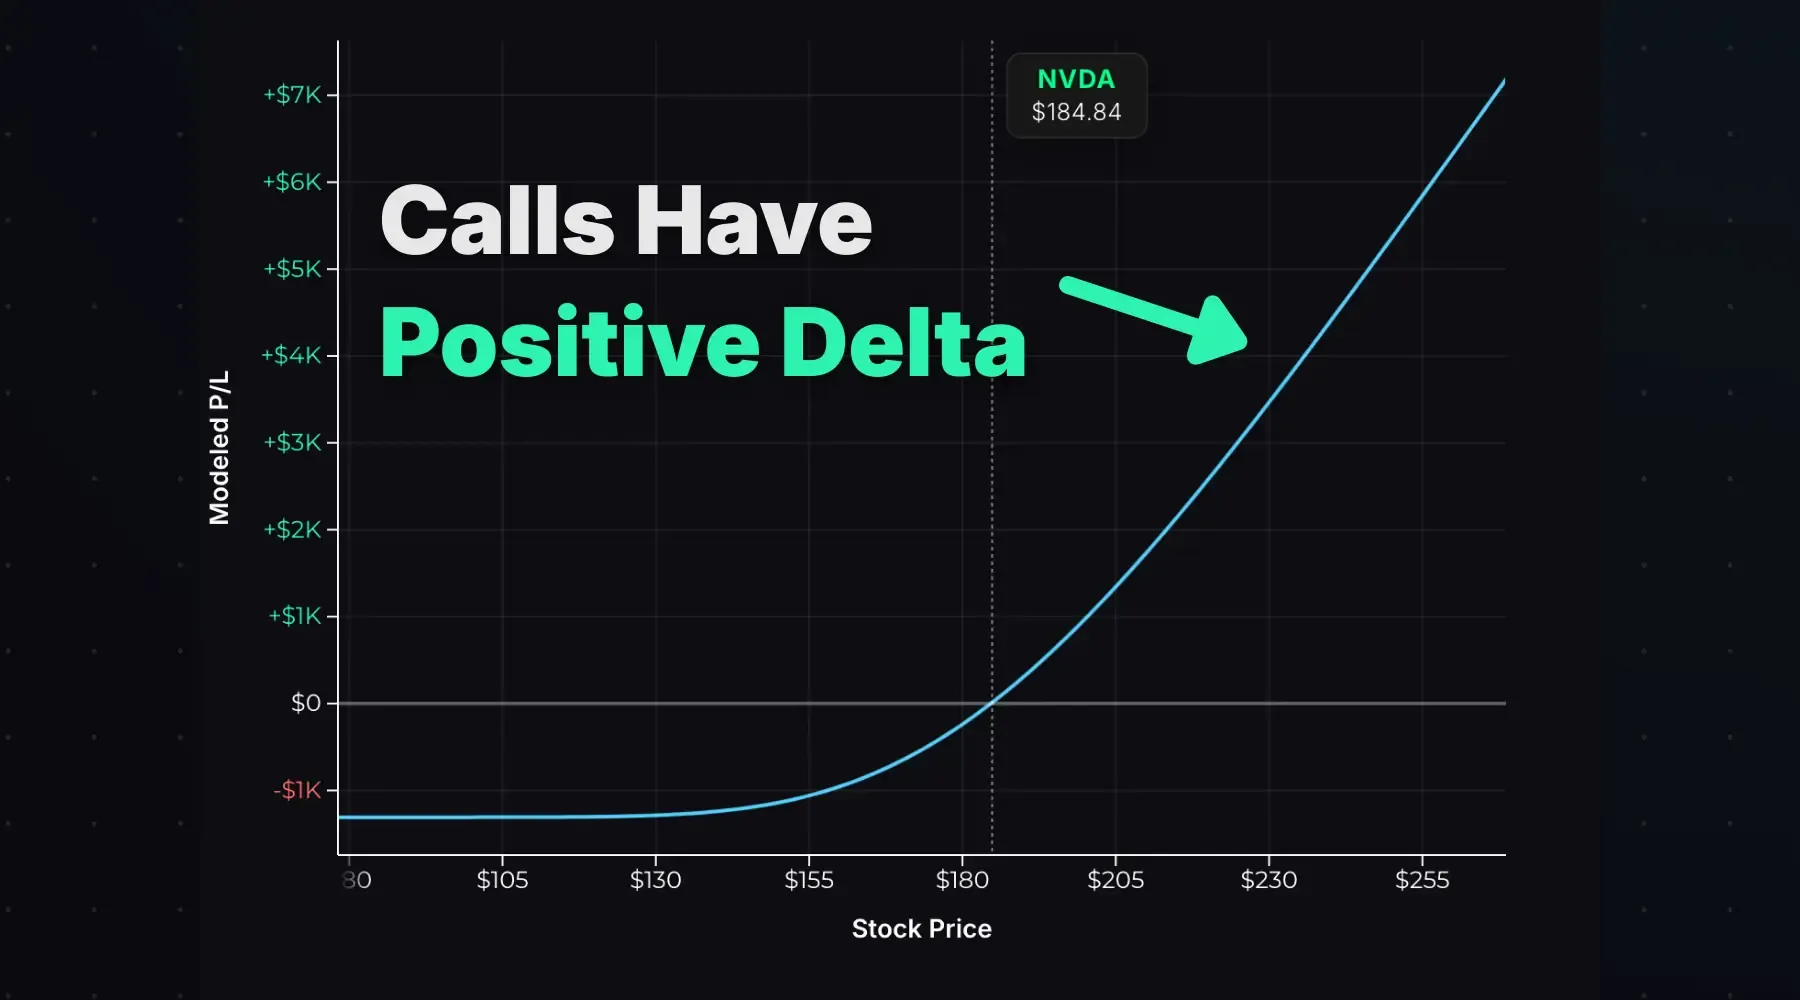
This is positive delta visualized: P/L increases with the stock price. On the far left, the P/L curve is flat; stock price changes don’t impact the call’s value. This is zero delta. On the far right, the P/L curve increases up and to the right, just like a long stock position. The call has a delta of +1.0.
Put Options Have Negative Delta
Put options move inversely to the stock price: they gain value when the stock falls and lose value when it rises. A put’s delta ranges from −1.0 to 0.
- Delta near 0: A deep out-of-the-money put. Stock price changes barely impact the put’s value.
- Delta near −0.50: An at-the-money put. The put’s price moves about half of the stock price, but inversely (stock up $1, put down $0.50).
- Delta near −1.0: A deep in-the-money put. If the stock rises $1, the put loses $1. It trades like short stock.
Here’s the P/L curve for a 475-strike TSLA put:
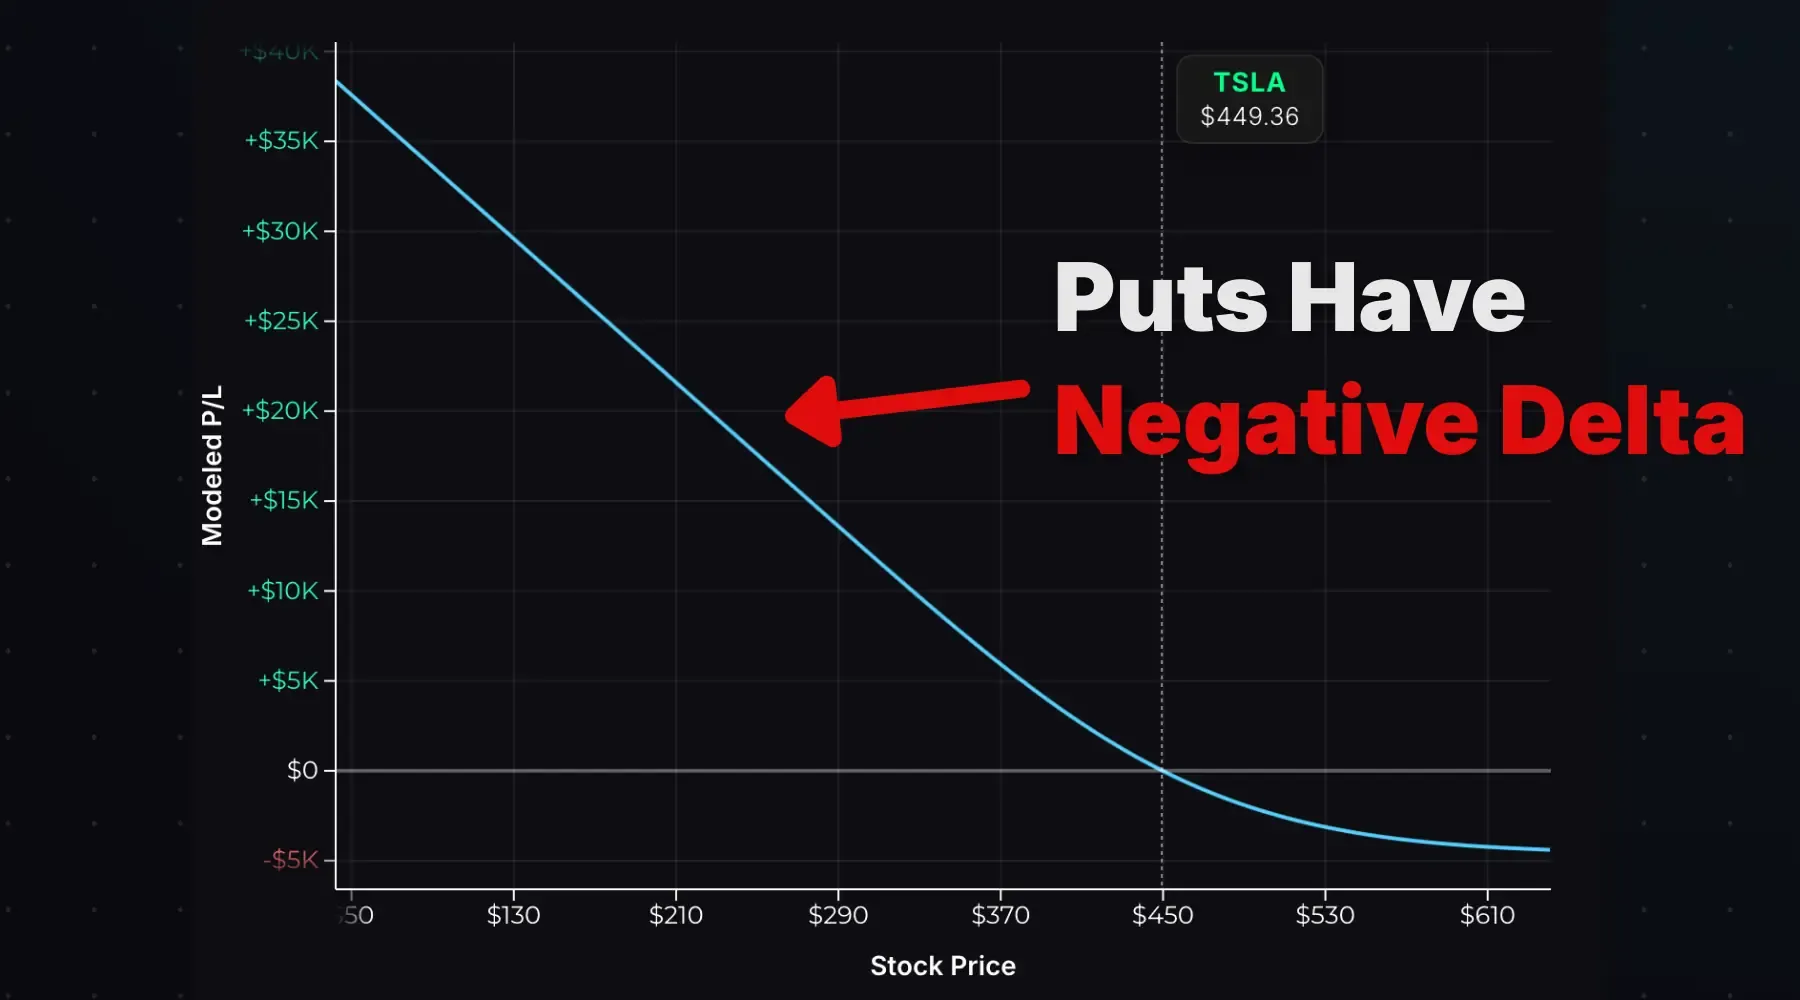
This is negative delta visualized: P/L increases as the stock falls. On the far right, the P/L curve is flat, at zero delta. On the far left, the P/L curve increases up and to the left, just like being short stock. The put has a delta of −1.0.
Position Delta: Measuring Dollar Risk
A call option might have a delta of +0.57, but if you own 100 contracts, your position delta is +5,700.
There’s a difference between an option’s delta and your position delta in dollar terms.
An option’s delta maxes out at 1.0 because the option’s price can only move one-for-one with the stock. But remember: each option contract controls 100 shares. A $1.00 change in an option’s price means a $100 P/L swing per contract.
To get position delta, multiply the option’s delta by 100, then by the number of contracts.
Example: You own 10 call contracts with a delta of +0.75.
- Each call gains $0.75 per $1 stock move = $75 per contract
- 10 contracts × $75 = +$750 position delta
This tells you: if the stock rises $1, you make $750. If it falls $1, you lose $750.
Here’s an example from the long call calculator: 10 contracts with a +738 position delta at a $100 initial stock price:
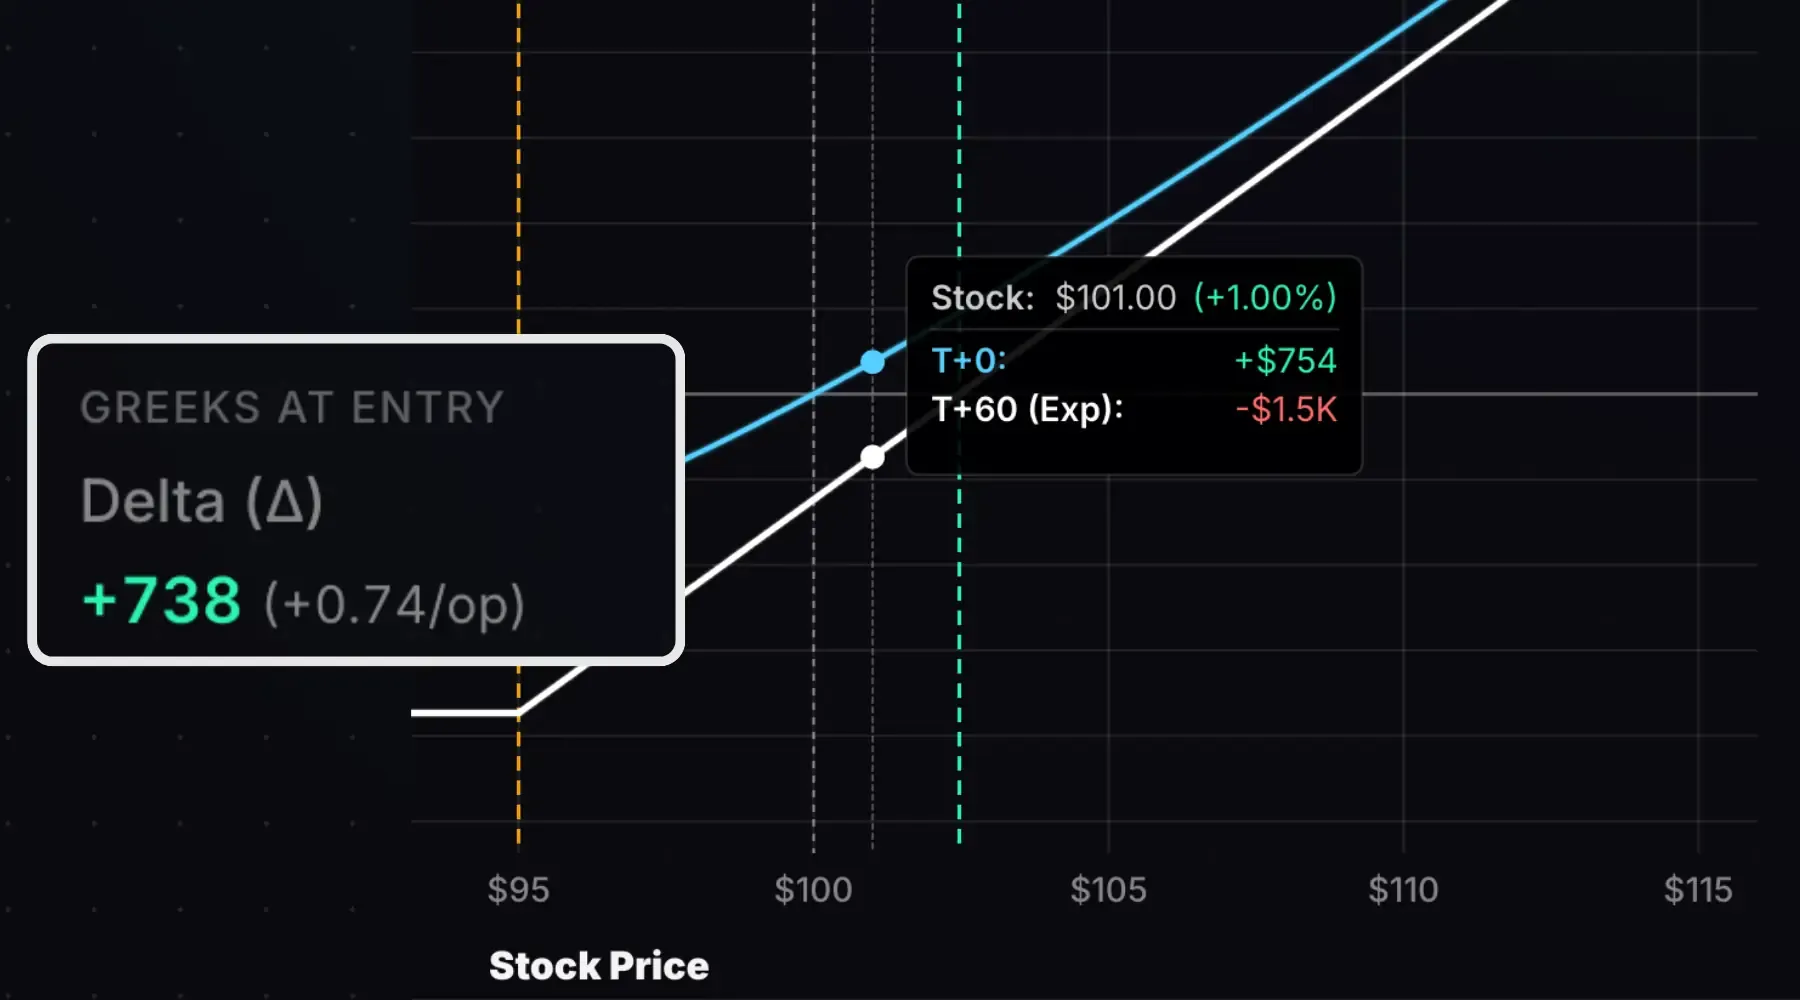
If the stock rose to $101 on the day of entry (T+0), the modeled call P/L is +$754. The P/L overshot the +$738 expectation since delta itself changes with the stock price, a concept called gamma, which we cover in another guide.
Short Options Flip the Sign
When you sell options, the delta sign reverses.
If you short a call with a delta of +0.50, your position delta is −50. You lose $50 when the stock rises $1 (because the call you sold becomes more expensive). Short puts work the same way: a put with −0.40 delta gives you a +40 position delta. A $1 stock price increase devalues the put by $0.40, a $40 gain for you.
| Position | Option Delta | Position Delta |
|---|---|---|
| Long Call | +0.50 | +50 |
| Short Call | +0.50 | −50 |
| Long Put | −0.40 | −40 |
| Short Put | −0.40 | +40 |
Portfolio Delta
To find your total directional exposure for a multi-leg option position, add up the position deltas across all of your options.
Example: You’re long 10 calls (+0.75 delta each) and long 10 puts (−0.25 delta each).
- Call Deltas: 10 × 0.75 × 100 = +750
- Put Deltas: 10 × −0.25 × 100 = −250
- Net Position Delta: +500
If the stock price goes up $1, your calls gain $750 while the puts lose $250. Your net P/L is +$500. A $1 drop does the opposite: calls lose $750, puts gain $250, net P/L is −$500.
Delta as the Probability of Expiring In-the-Money
Delta also serves as a rough estimate of an option’s probability of expiring in-the-money.
- Deep OTM options (delta near 0): Low probability of expiring ITM. The stock would need to move significantly.
- ATM options (delta near 0.50): Roughly 50/50 odds of expiring ITM.
- Deep ITM options (delta near 1.0): High probability of expiring ITM. The stock would need to make a big move for the option to expire OTM.
One useful way to think about this: delta represents probability-weighted share exposure.
A call with a delta of +1.0 has a near 100% chance of expiring in-the-money and becoming 100 shares. So it trades like 100 shares.
A call with a delta of +0.20 has roughly a 20% chance of expiring in-the-money. If the call has a 20% chance of becoming 100 shares, then it trades like 20 shares of stock.
Next: What Is Gamma?: Learn how delta changes as the stock moves.
Related Resources
- What Is Theta in Options Trading?: Time decay explained
- What Is Vega in Options Trading?: Volatility sensitivity explained
- Options Greeks Overview: All four primary Greeks
- Options Pricing Calculator: Calculate delta and other Greeks