What Is a Bull Put Spread? | Beginner's Guide
Bull put spreads explained visually: payoff diagrams, Greeks tables, and examples showing how the strategy works.
A bull put spread, or put credit spread, combines selling a put at a higher strike and buying a put at a lower strike, same expiration and underlying asset. This moderately bullish strategy has defined risk and limited profit potential. It’s one of the four vertical spread strategies (two strike prices, one expiration).
Bull put spreads work best when you’re bullish and expect the stock to stay above a specific price.
With the stock at $200, an example bull put spread would be:
- Sell one 180 put at $7.00
- Buy one 170 put at $4.00
- Net Credit: $3.00
Resulting Position: a 170 / 180 bull put spread entered for a net credit of $3.00.
Selling the 180 put naked would collect $7.00 but carry significant downside risk. Adding the long 170 put for $4.00 limits your maximum loss in exchange for less reward than selling the put on its own.
Payoff Diagram
The bull put spread payoff diagram has defined risk on the downside, and limited profit potential on the upside:
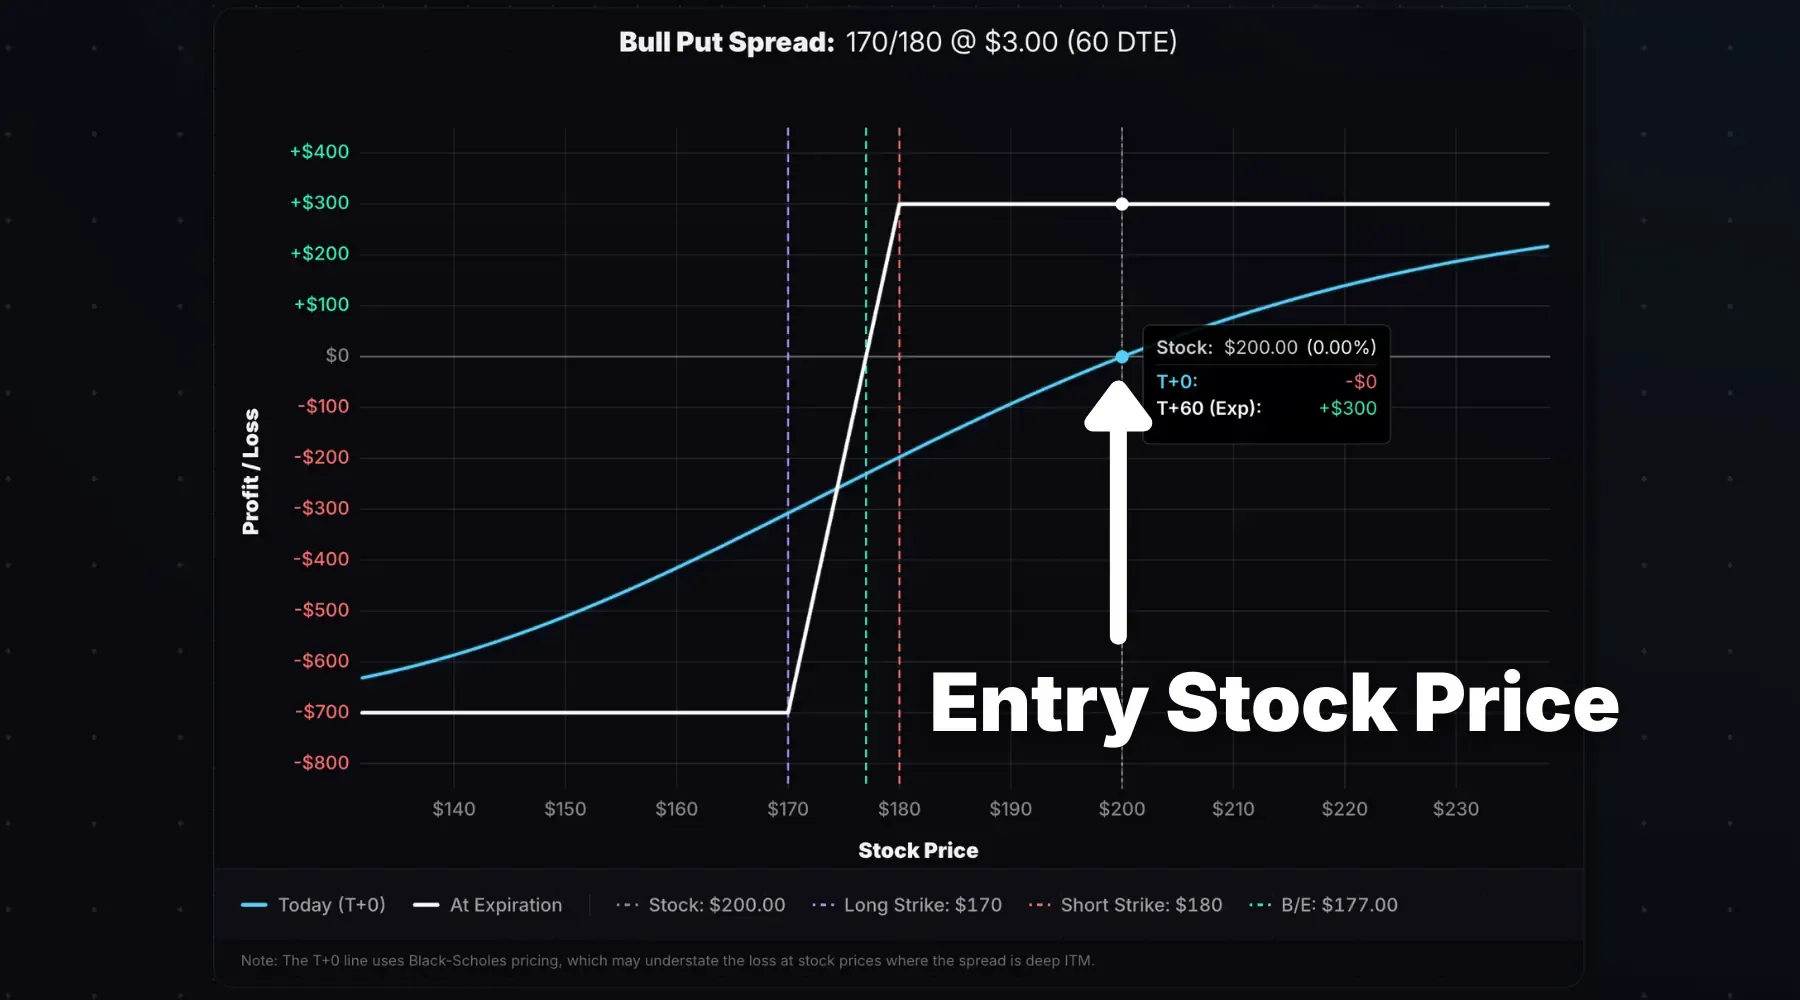
Stock at Entry: $200. Trade: 170/180 put credit spread entered for a $3.00 net credit. 60 days to expiration (DTE).
The white line shows the payoff at expiration. The max profit of $300 occurs if the stock price is at or above the short put strike of $180 (-10% buffer). The max loss of $700 occurs if the stock price is at or below the long put strike of $170 (stock falls 15%+).
The cyan line (T+0) shows the payoff right now (entry in this case). Profits and losses are muted before expiration because both options still have extrinsic value. The max profit/loss only occurs when extrinsic value is gone: either at expiration or when the spread is deep ITM/OTM.
Key Characteristics
- Max Profit: Net credit × 100 × number of spreads. Occurs if the stock closes at or above the short put strike at expiration.
- Max Loss: (Spread width − net credit) × 100 × number of spreads. Occurs if the stock closes at or below the long put strike at expiration.
- Breakeven: Short put strike − net credit
- Outlook: Moderately bullish
Here are the metrics for a 170/180 put spread sold for a $3.00 net credit:
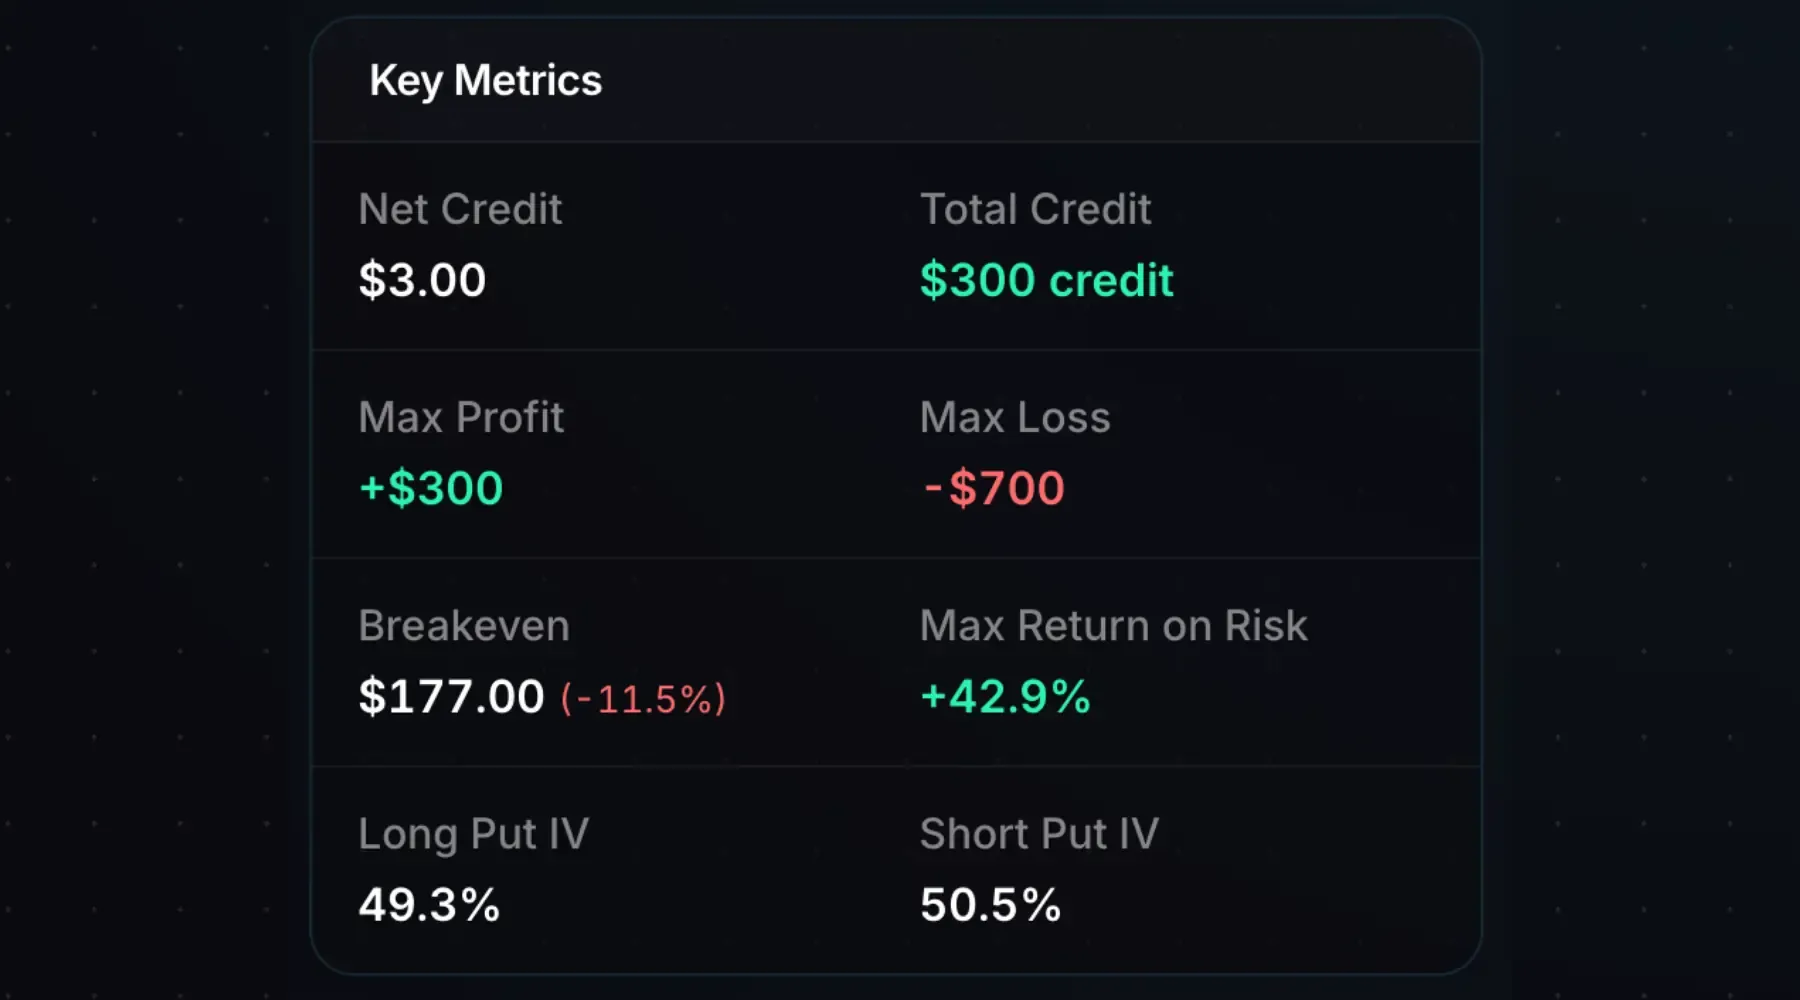
- Max Profit: $300 (net credit × 100)
- Max Loss: $700 (spread width of $10 − $3 net credit = $7 × 100)
- Breakeven: $177 (short put strike − net credit)
- Max Return on Risk: +42.9%
Achieving the max profit requires the stock to be $180+ at expiration. As long as the stock price isn’t 10%+ lower at expiration, the position achieves max profit.
At $177 (breakeven), the spread value equals the credit received.
The max loss requires the stock to fall 15% or more by expiration (< $170).
How the Greeks Affect a Bull Put Spread
Vertical spread Greeks are nuanced: gamma, theta, and vega flip depending on where the stock is relative to the strikes.
| Greek | Near Short Strike | Near Long Strike |
|---|---|---|
| Delta (Δ) | Positive | Positive |
| Gamma (Γ) | Negative | Positive |
| Theta (Θ) | Positive | Negative |
| Vega (ν) | Negative | Positive |
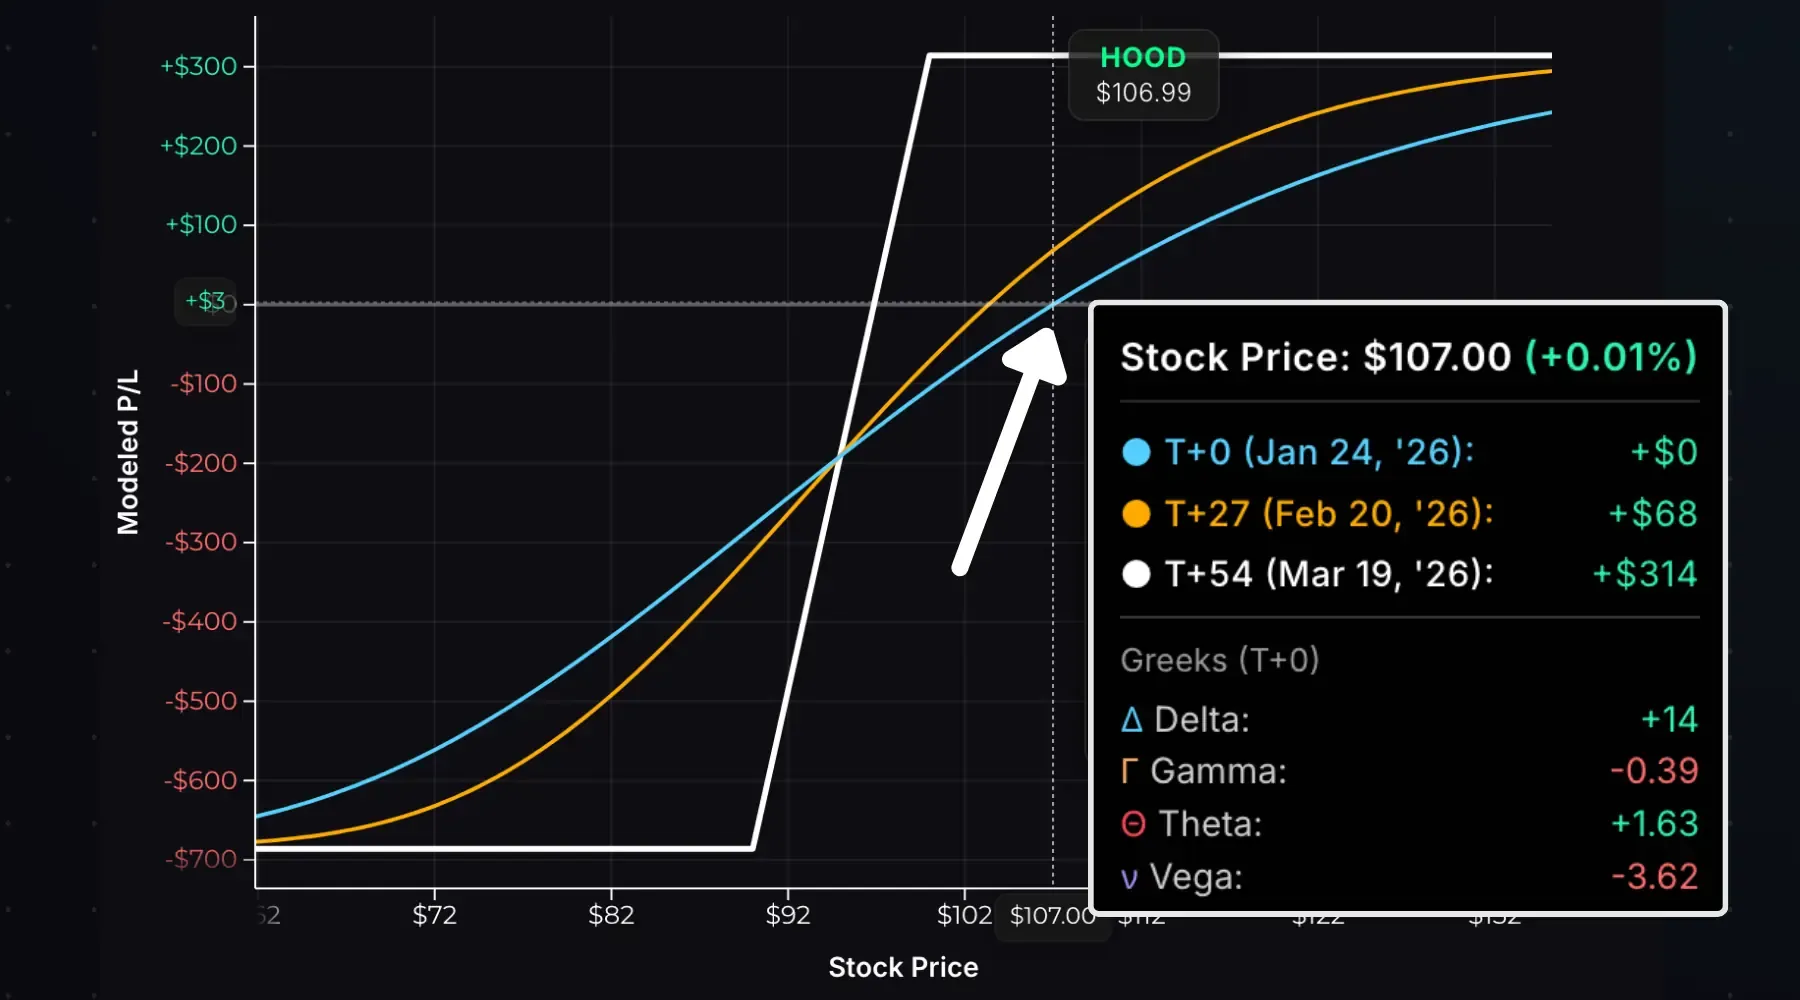
Here’s a 90/100 bull put spread on HOOD with the stock above the short put strike:
And with the stock near the long put strike:
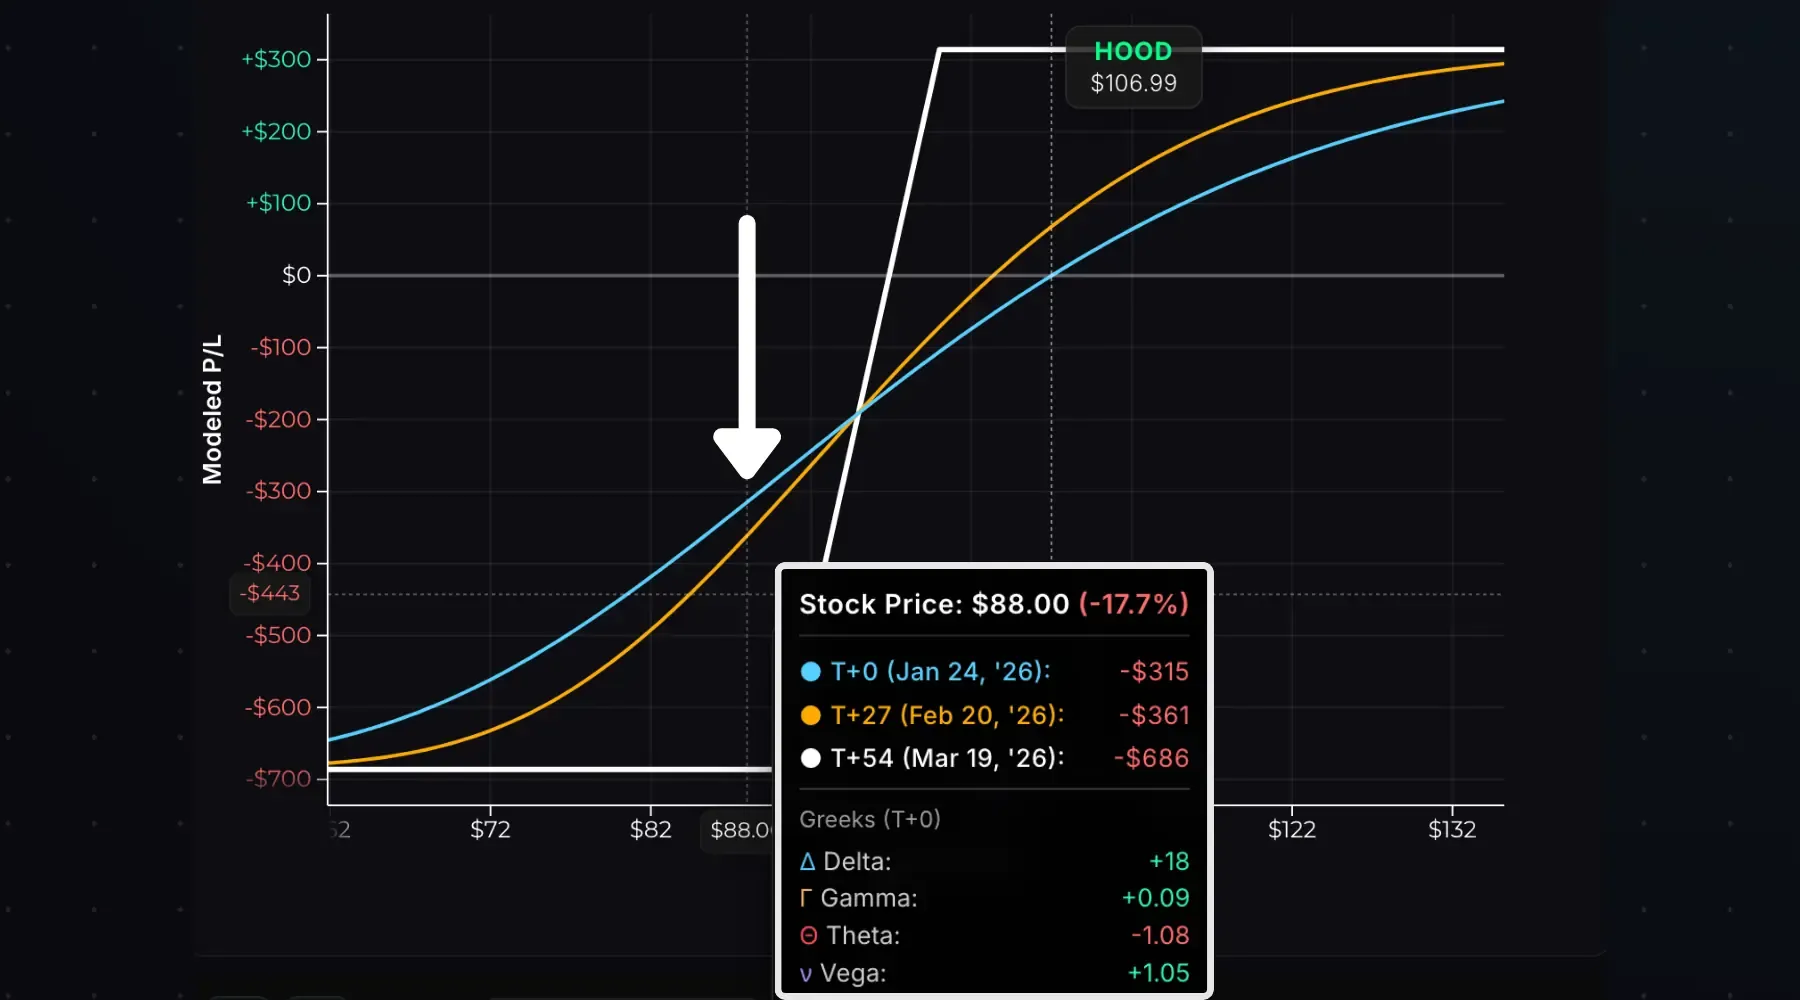
You can see the Greeks by comparing the T+0 line to the expiration line:
- Near the short strike ($100): T+0 is below the expiration P/L. Profits grow as time passes (positive theta). Falling IV helps because the short put loses more extrinsic value than the OTM long put.
- Near the long strike: T+0 is above the expiration P/L. Losses grow as time passes (negative theta). Rising IV helps because the ATM long put has higher vega than the OTM short put.
A common claim is that “credit spreads are ideal when IV is high,” implying falling IV helps. This is true when the spread is out-of-the-money. If the stock moves against you, toward the long strike, you want IV to rise, not fall.
Time Decay
Unlike a naked short put, a bull put spread has partially offsetting theta. The short put has positive theta and the long put has negative theta.
When the stock is near the short put strike, net theta is positive, and time passing benefits your P/L. As the stock approaches the long strike, net theta flips negative, and time starts working against you.
Choosing Strike Prices
Strike selection affects credit received, risk/reward, breakeven, and probability of profit.
It’s unusual to sell ITM credit spreads, so our baseline will be selling an ATM put and buying an OTM put.
Consider three $10-wide put spreads on a $200 stock with 60 DTE and 25% IV:
| Spread | Net Credit | Max Profit | Max Loss | Breakeven | Max Return |
|---|---|---|---|---|---|
| 190/200 (ATM) | $3.87 | $387 | $613 | $196.13 (-1.94%) | 63.1% |
| 180/190 (OTM) | $2.13 | $213 | $787 | $187.87 (-6.06%) | 27.1% |
| 170/180 (OTM) | $0.91 | $91 | $909 | $179.09 (−10.5%) | 10.0% |
The ATM spread collects the most credit, but has the lowest probability of profit: the stock can only fall 1.94% before the position loses money at expiration. The max return is 63.1%, risking $613 to make $387.
The deep OTM spread collects the least credit, but has the highest probability of profit: the stock can fall 10.5% before the position loses money at expiration. The max return is 10.0%, risking $909 to make $91.
Key Insight: Pushing strikes further OTM decreases reward and increases risk, but lowers the breakeven and increases the probability of profit.
-
ATM Spreads: lower probability, higher payoff.
-
OTM Spreads: higher probability, lower payoff.
Use the bull put spread calculator to model different strike combinations.
Choosing an Expiration
A bull put spread’s max profit occurs when both options lose all extrinsic value, typically at expiration. Even when your spread is fully OTM, you need time decay to finish the job.
Compare two 90/100 put spreads on HOOD at $106.99. First, 54 DTE:
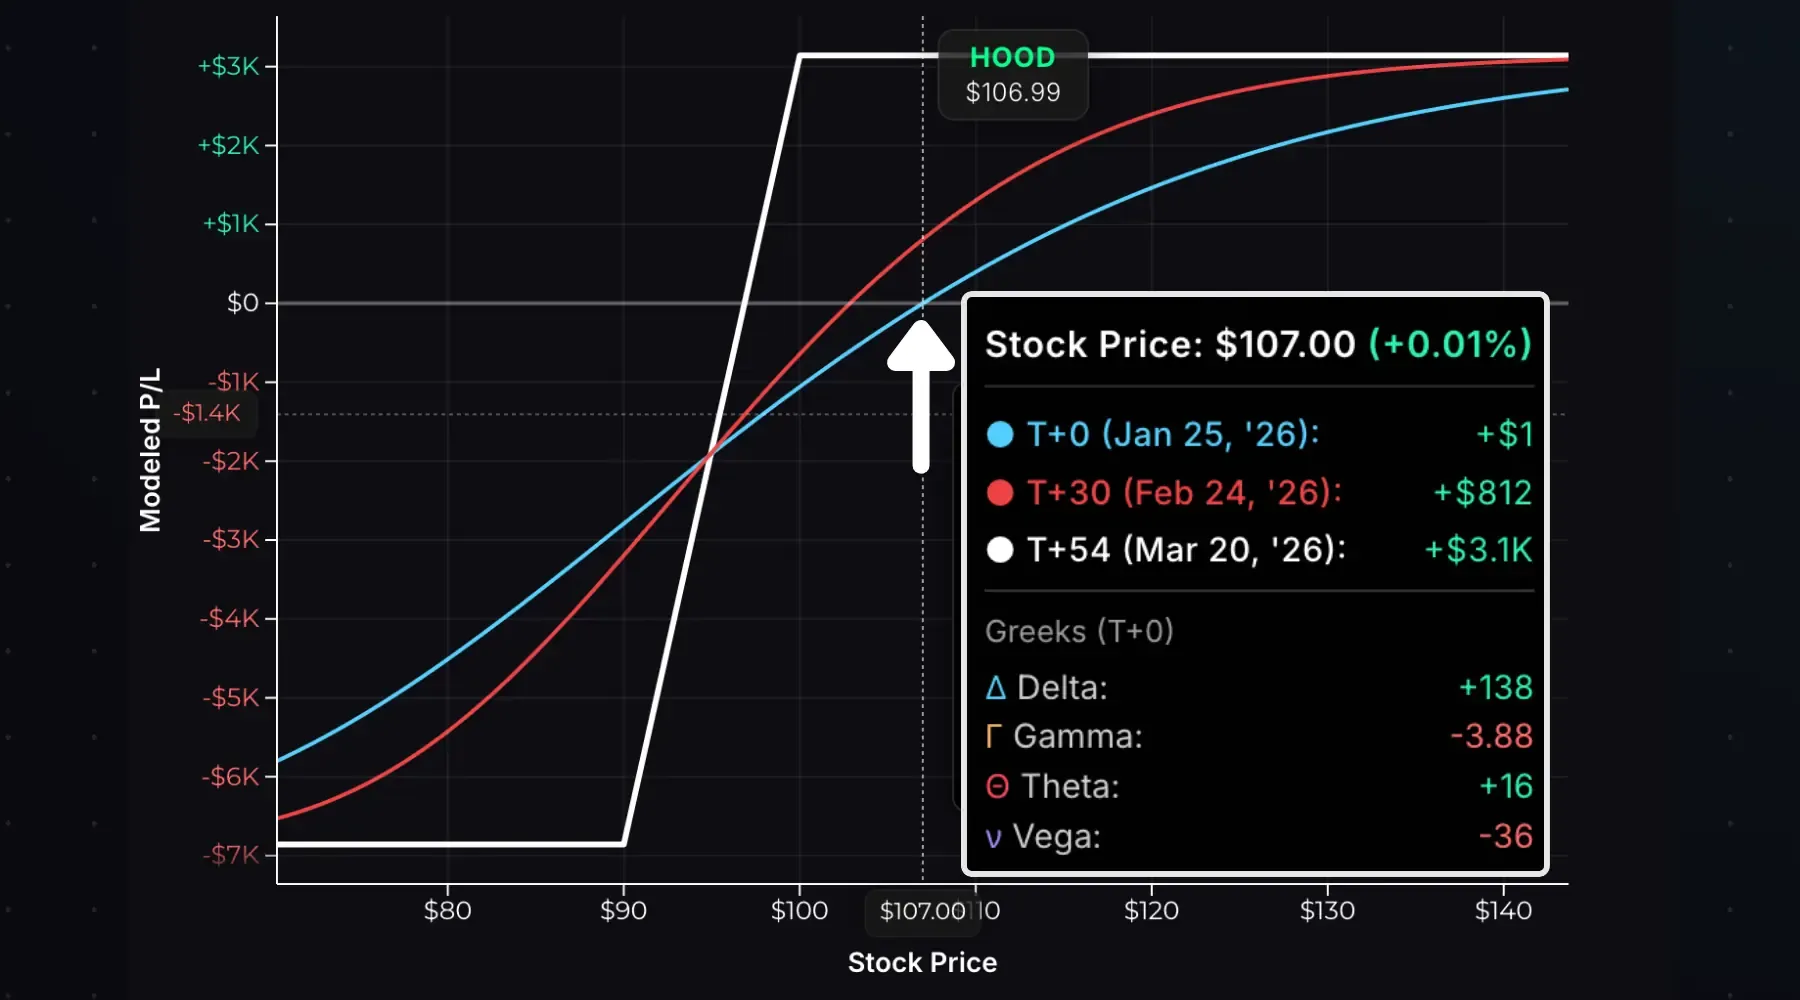
Theta is +$16/day. The T+30 (30 days from now) P/L line projects $812 profit if nothing else changes, 26% of the max profit captured in 30 days.
Now the same strikes at 110 DTE:
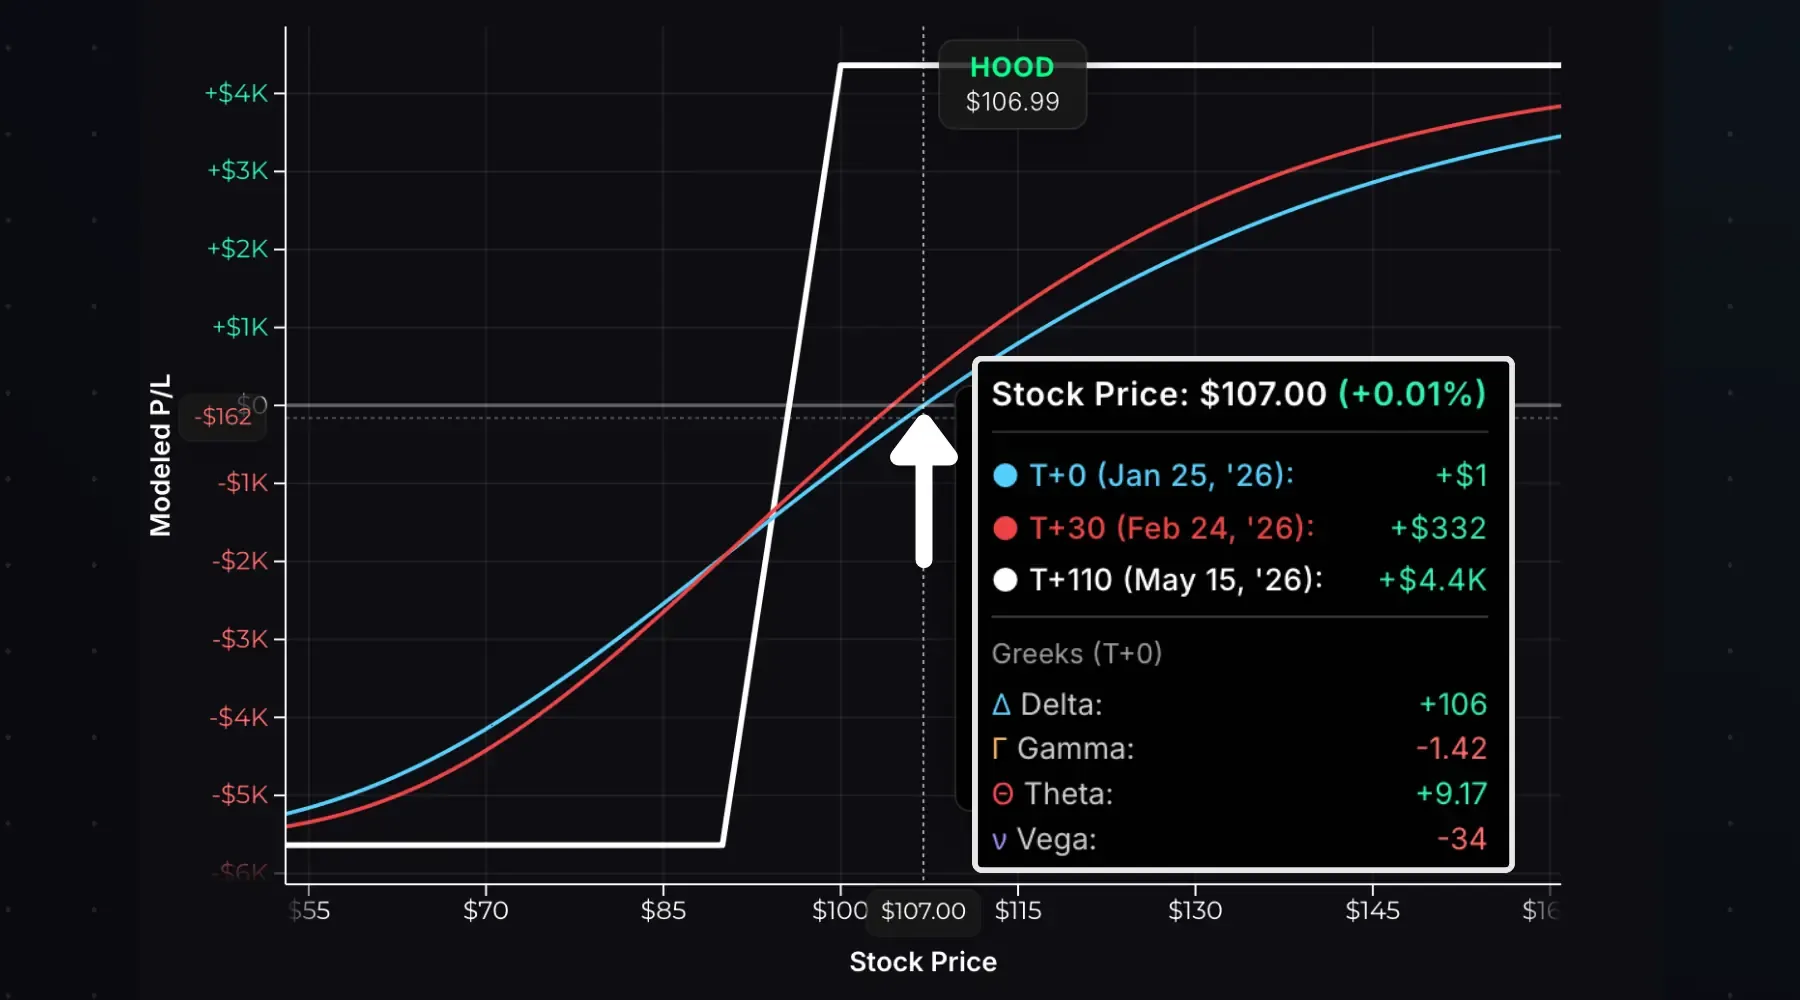
Theta drops to +$9.17/day. T+30 projects +$332, only 8% of the max profit.
Doubling time to expiration doesn’t double the profit potential. The longer-term spread offers 42% more credit, not 100%.
| Shorter-Term (30-45 DTE) | Longer-Term (90+ DTE) | |
|---|---|---|
| Theta Decay | Faster | Slower |
| Credit Collected | Less | More |
| Gamma Risk | Higher (moves hurt more) | Lower |
| Margin for Error | Less | More |
The sweet spot is 30-45 DTE. In this timeframe, you can sell put spreads far enough OTM to give yourself room for stock volatility, but not so far out that you’re locked into a slow-decaying position.
Bull Put Spread vs Bull Call Spread
Both spreads are synthetically equivalent using the same strikes:
- 100/110 bull call spread: long 100 call, short 110 call
- 100/110 bull put spread: long 100 put, short 110 put
Both reach the max profit above $110, and hit max loss below $100 at expiration.
So which one should you use? Avoid selling ITM options. Use whichever spread keeps your short strike OTM.
Example #1: HOOD is at $105. You think it’s going to $115+.
A 105/115 bull call spread sells the OTM 115 call. A 105/115 bull put spread sells the ITM 115 put. Use the call spread here.
Example #2: HOOD is at $105. You think it’s going to stay above $100.
A 90/100 bull call spread sells the ITM 100 call. A 90/100 bull put spread sells the OTM 100 put. Use the put spread here.
Key Insight: If your spread construction requires selling an ITM option, flip to the other spread type.
Early Assignment
The short put in your spread can be assigned early if it’s ITM before expiration.
If your short put is assigned, you buy 100 shares at the short strike price.
You still own the long put, so your risk remains defined, but your profit potential becomes uncapped since you have long stock instead of a short put. To close the position, you can:
- Exercise your long put to sell the shares at the long strike, realizing max loss
- Hold the shares if you’re bullish, with the long put as protection
- Sell the shares and the long put in the same closing transaction to close the position
Early assignment typically happens when the short put is deep ITM with little extrinsic value remaining. This means if you have 30 DTE and your short put is only slightly ITM (100 short put and the stock is at $101), your risk of early assignment is low. Pay attention to the extrinsic value in the short put. If it’s close to zero, early assignment risk is high.
Entry, Exit, and Expiration
To enter: Place a spread order to sell the higher strike put and buy the lower strike put simultaneously. You’ll receive a credit to enter the trade.
To exit before expiration: Close the spread by buying back the short put and selling the long put in a single order. You’ll pay a debit when exiting the trade. Your profit or loss per spread will be the difference between the net credit at entry and net debit at exit.
If you hold the spread through expiration:
| Scenario | Stock Price | Result |
|---|---|---|
| Both Puts OTM | ≥ Short strike | Both puts expire worthless. Max profit. |
| Partially ITM | Between strikes | Short put assigned, long put expires. You buy 100 shares per short put. |
| Both Puts ITM | ≤ Long strike | Short put assigned and long put exercised, net zero shares. Max loss. |
Using a 90/100 put spread entered for $4.00 credit that’s held through expiration:
- Stock at $105: Both puts expire worthless. You keep the $400 credit.
- Stock at $95: Short put auto-assigns (buy shares at $100). Long put expires. You own 100 shares at a $91 cost basis (short strike − credit).
- Stock at $85: Short put assigns, long put exercises. You buy 100 shares at $100 and sell at $90, a $1,000 loss on the shares, minus the $400 credit = $600 net loss (max loss).
Avoid the partially ITM scenario. If your short put is assigned while the long expires worthless, you’ll end up owning shares, creating significant downside risk instead of the defined-risk spread you started with.
- A bull put spread is a moderately bullish strategy with defined risk and limited profit potential.
- Max profit = net credit × 100 × number of spreads. Max loss = (spread width − net credit) × 100 × number of spreads. Breakeven = short put strike − net credit.
- Gamma, theta, and vega flip as the stock moves from the short strike to the long strike.
- Deep OTM spreads have higher probability but lower reward; Near ATM spreads have lower probability but higher reward.
- Bull put spreads profit when the stock stays flat, rises, or falls slightly and your spread stays OTM, a high probability trade.
- Early assignment on the short put means buying shares. Your long put keeps risk defined, but you’ll need to manage the position.
Related Guides
- What Is a Bull Call Spread?: Bullish debit spread alternative
- What Is a Bear Put Spread?: Bearish debit spread alternative
- What Is a Cash-Secured Put?: Sell puts for income while waiting to buy stock
- What Is Delta?: How option prices change with the stock price
- What Is Theta?: Understanding time decay
Ready to model your own spreads? Use our Bull Put Spread Calculator to visualize P/L for any strike combination.