What Is a Bull Call Spread? | Beginner's Guide
Bull call spreads explained visually: payoff diagrams, Greeks tables, and examples showing how the strategy works.
A bull call spread, or call debit spread, is buying a call at a lower strike and selling a call at a higher strike, same expiration, same underlying. This moderately bullish strategy has defined risk and capped profit. It’s one of the four vertical spreads (two strike prices, one expiration).
Bull call spreads work best when you’re bullish and expect the stock to move higher to a specific price.
With the stock at $100, an example bull call spread would be:
- Buy one 95 call at $7.50
- Sell one 105 call at $2.50
- Net Debit: $5.00
Resulting Position: a 95 / 105 bull call spread entered for a net debit of $5.00.
Buying the 95 call on its own costs $7.50, while buying this spread costs $5.00. This reduces the cost and risk of the trade, and lowers the breakeven price.
Payoff Diagram
The bull call spread payoff diagram has defined risk on the downside, and limited profit potential on the upside:
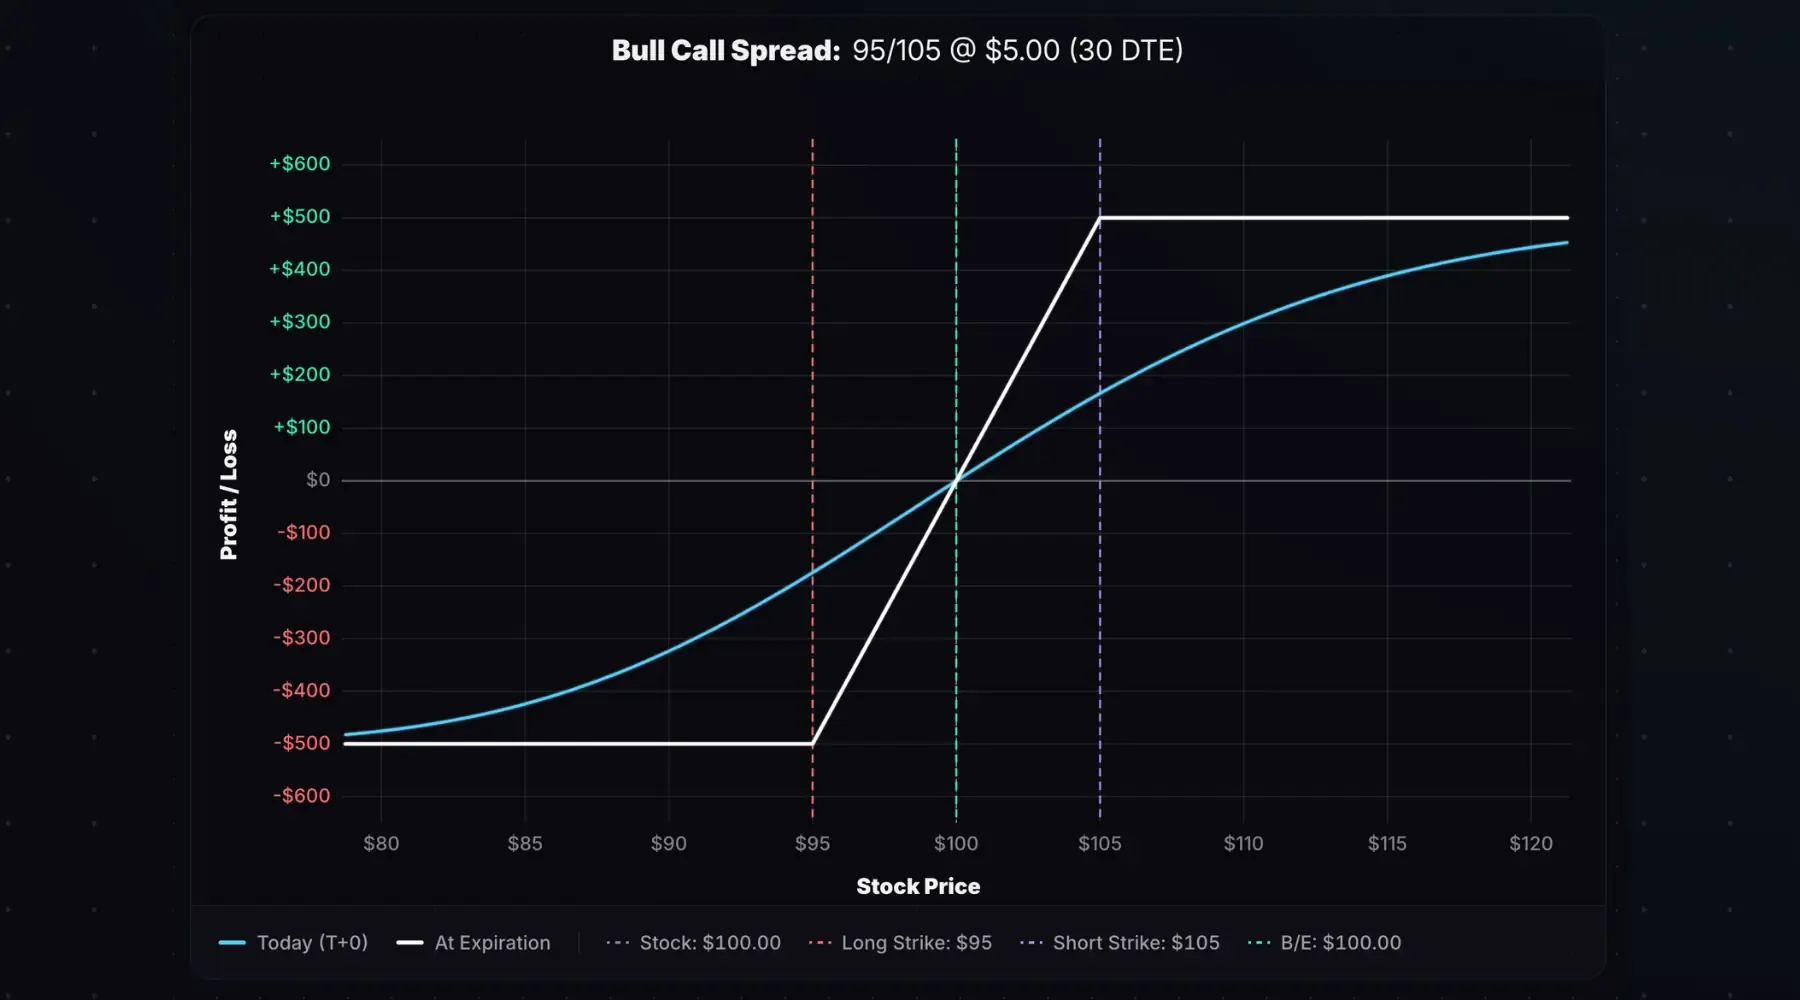
Stock at Entry: $100. Trade: 95/105 call spread entered for a $5.00 net debit. 60 days to expiration (DTE).
The white line shows the payoff at expiration. The max loss of $500 occurs if the stock price is at or below the long call strike of $95. The max profit of $500 occurs if the stock price is at or above the short call strike of $105.
The cyan line (T+0) shows the payoff right now (entry in this case). Profits and losses are muted before expiration because both options still have extrinsic value. Max profit/loss only occurs when extrinsic value is gone: either at expiration or when the spread is deep ITM/OTM.
Key Characteristics
- Max Profit: (Spread width − net debit) × 100 × number of spreads
- Max Loss: Net debit × 100 × number of spreads. Occurs if the stock closes at or below the long call strike at expiration.
- Breakeven: Long call strike + net debit
- Outlook: Moderately bullish
Here are the metrics for a 100/110 call spread purchased for a $4.00 net debit:
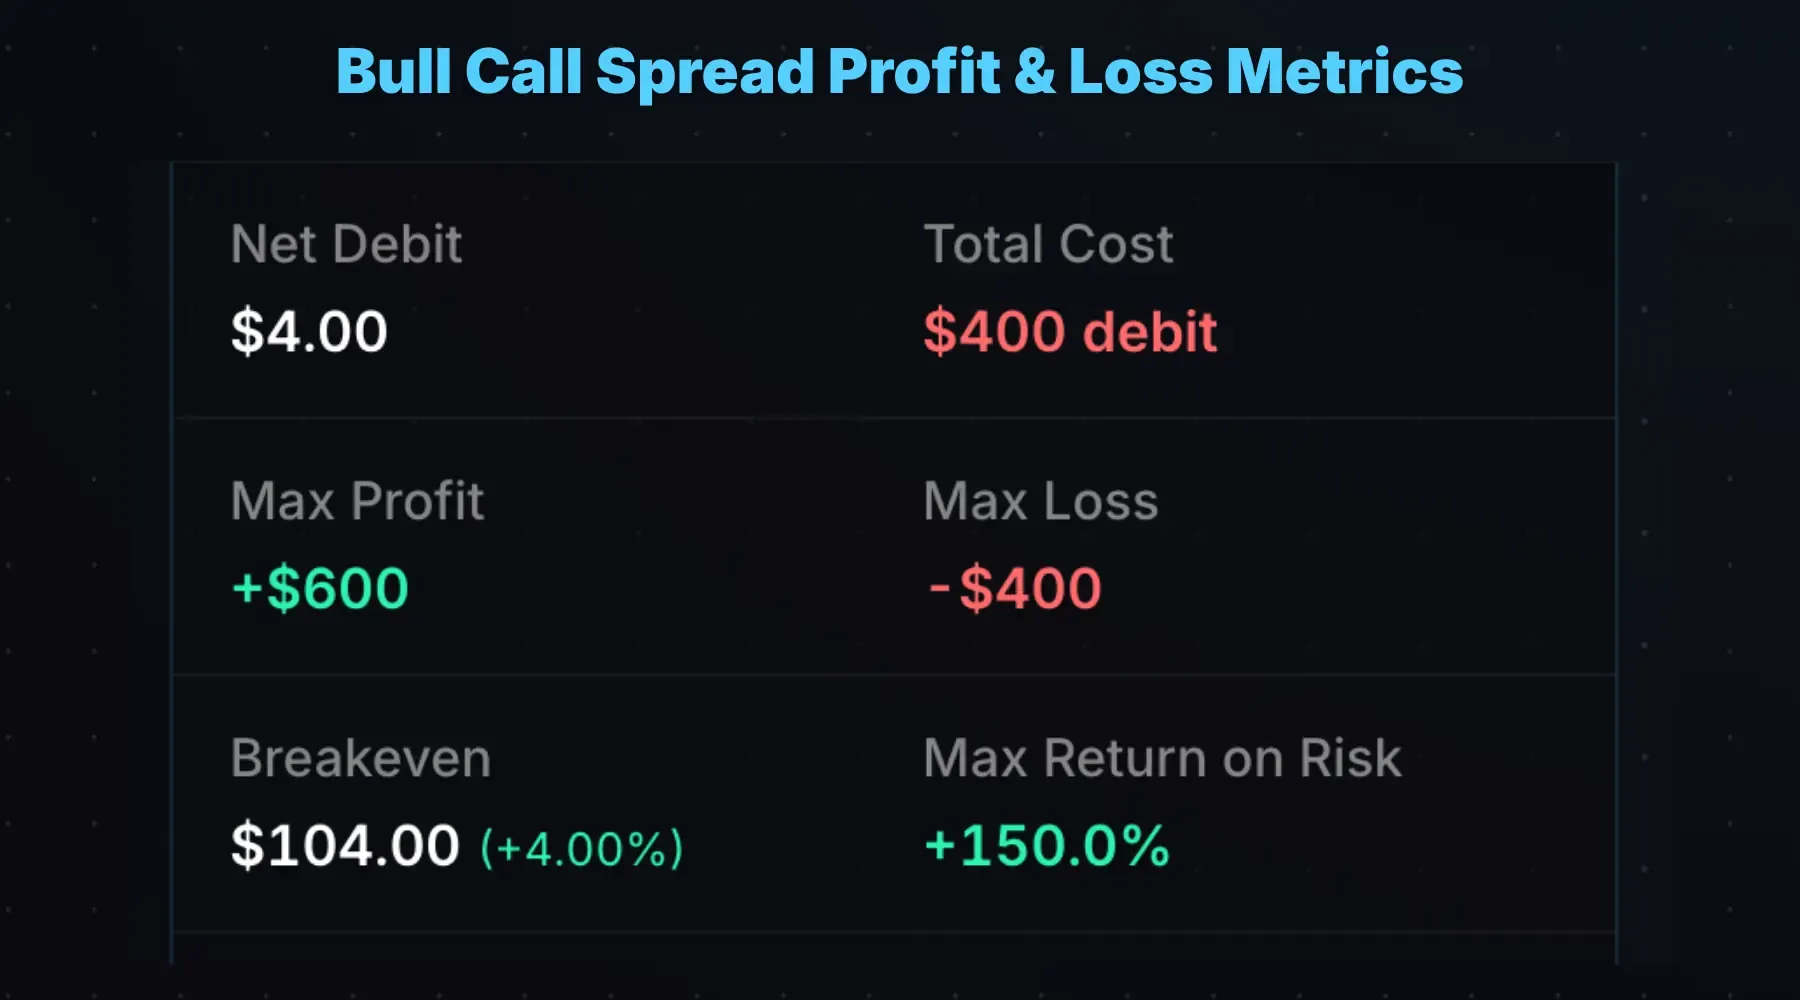
- Max Profit: $600 (spread width of $10 − $4 net debit = $6 × 100)
- Max Loss: $400 (net debit × 100)
- Breakeven: $104 (long call strike + net debit)
- Max Return on Risk: +150%
Achieving the max profit requires the stock to be $110+ at expiration, a 10% move, but a 150% return. At $104 (breakeven), the spread value equals the entry cost.
How the Greeks Affect a Bull Call Spread
Vertical spread Greeks are nuanced: gamma, theta, and vega flip depending on where the stock is relative to the strikes.
| Greek | At Long Strike | At Short Strike |
|---|---|---|
| Delta (Δ) | Positive | Positive |
| Gamma (Γ) | Positive | Negative |
| Theta (Θ) | Negative | Positive |
| Vega (ν) | Positive | Negative |
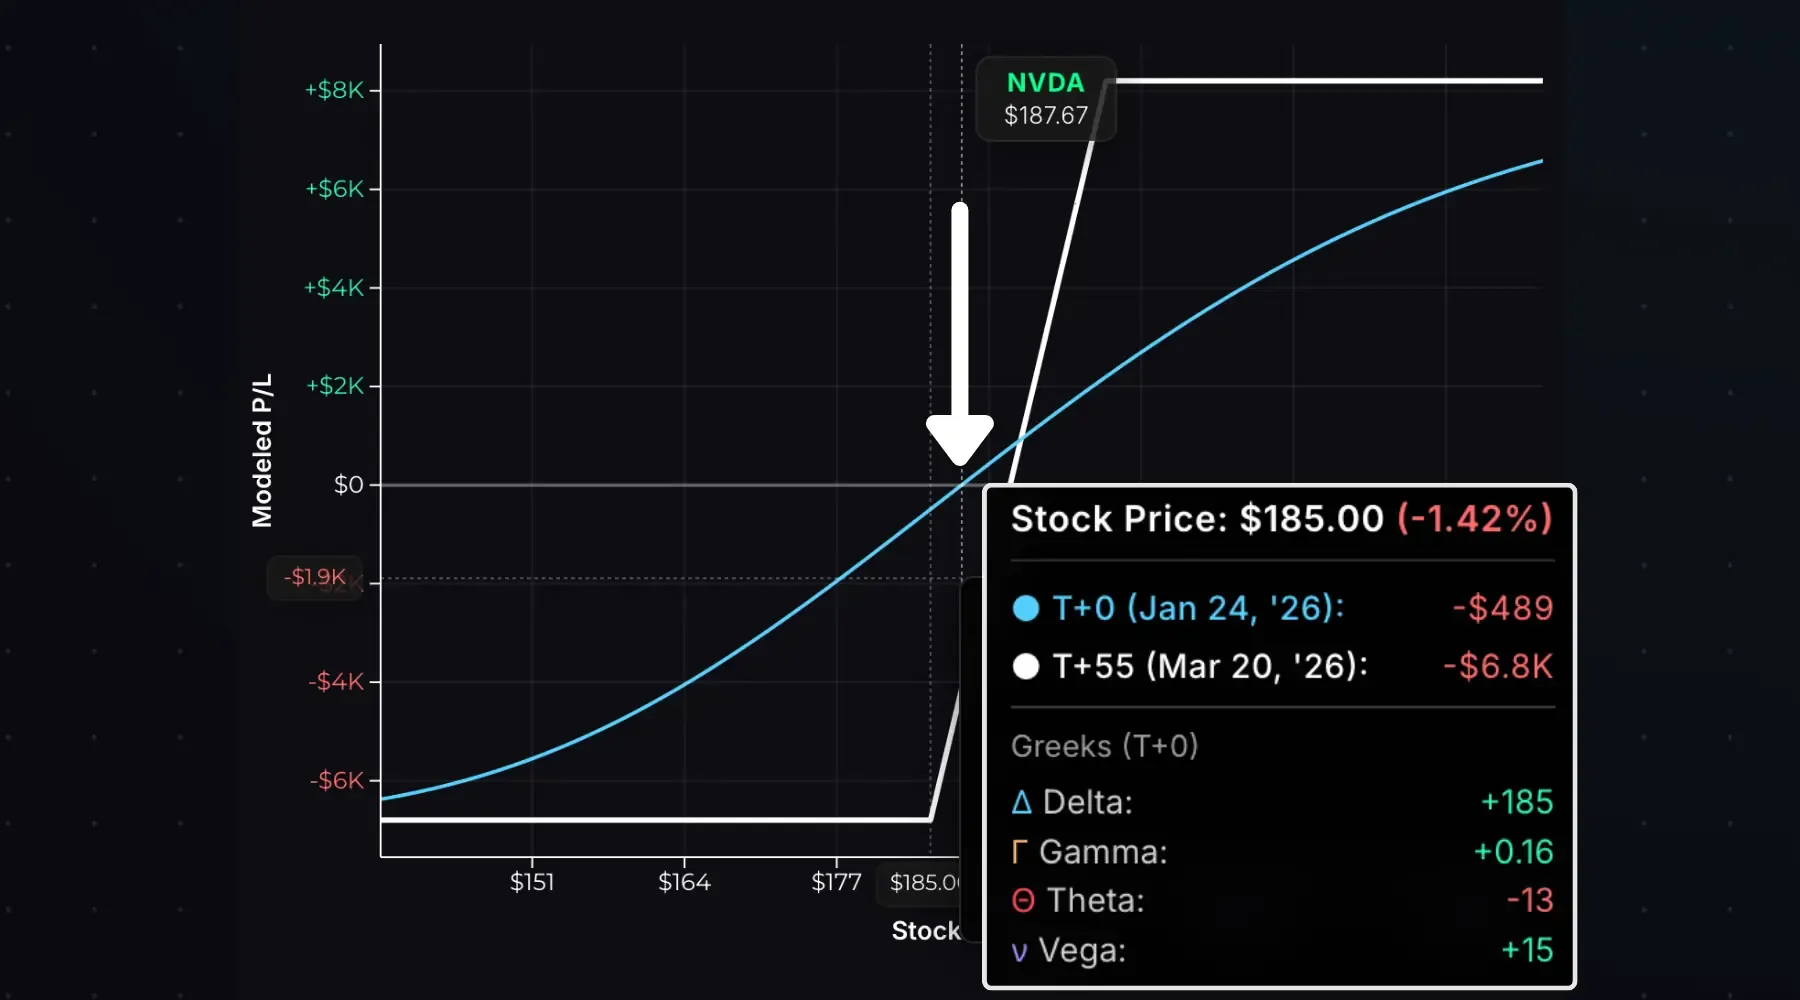
Here’s a 185/200 bull call spread on NVDA with the stock at the long strike ($185):
And with the stock at the short strike ($200):
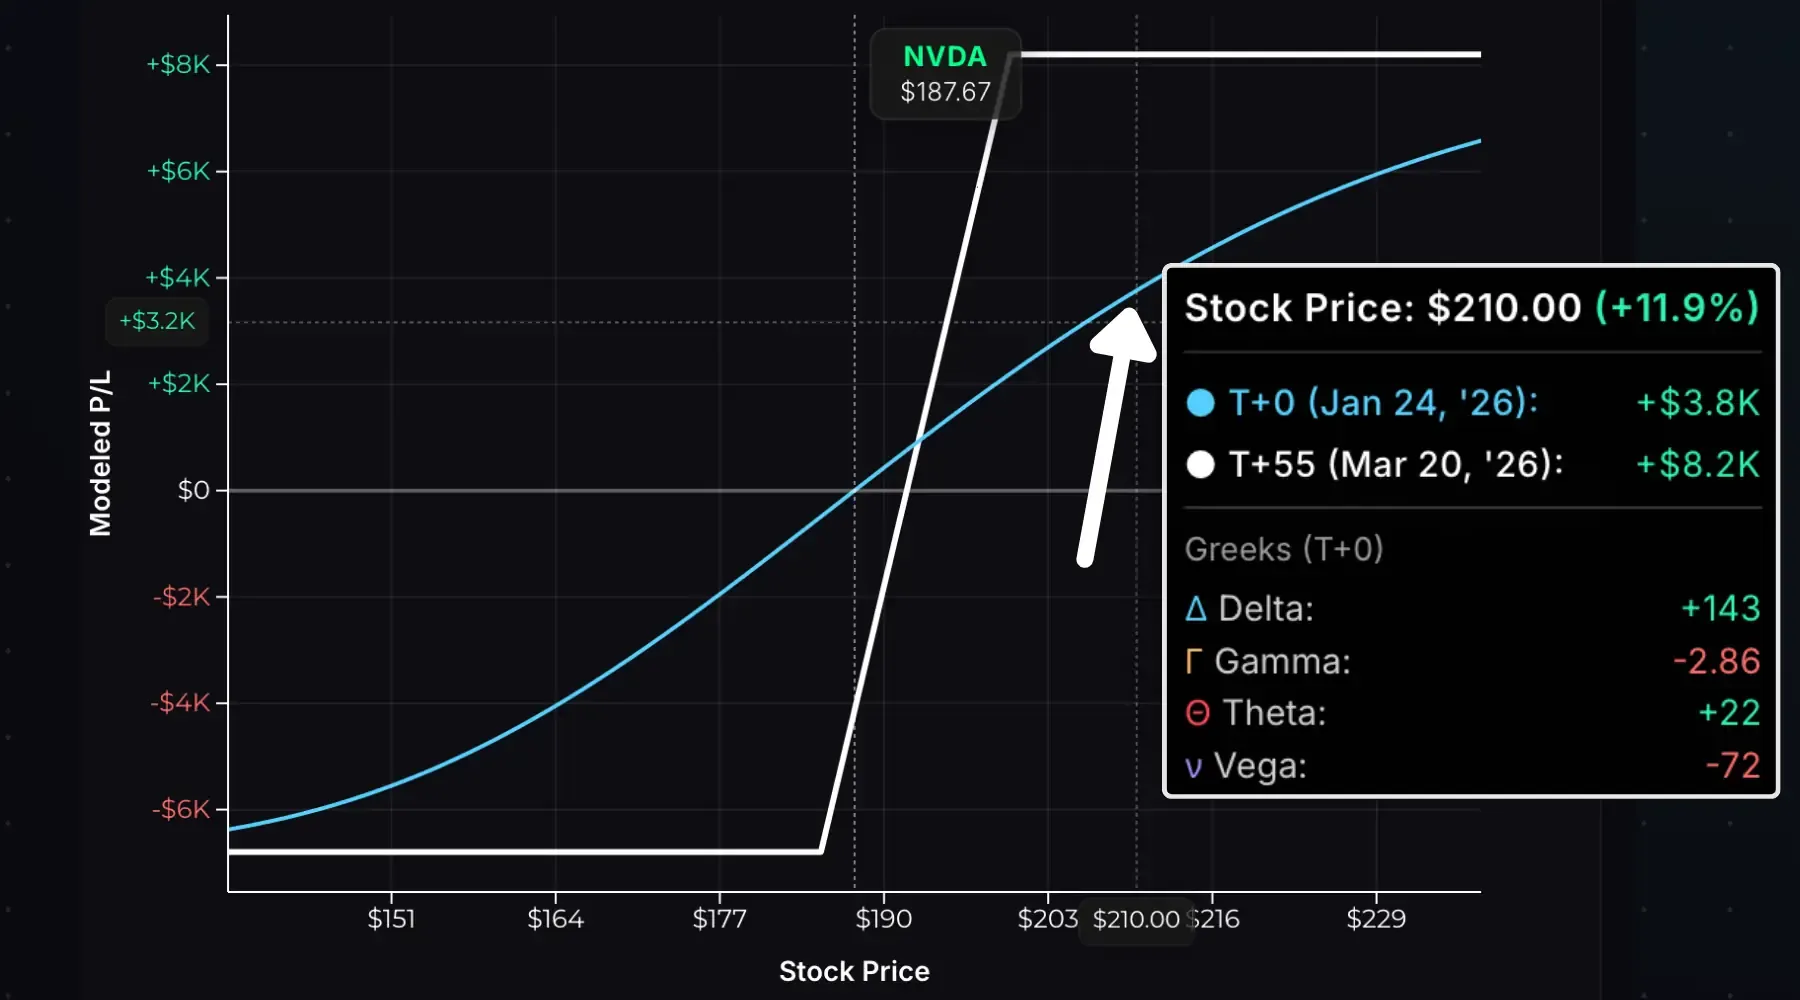
You can see the Greeks by comparing the T+0 line to the expiration line (T+55):
- At the long strike: T+0 is above expiration. Losses grow as time passes (negative theta). Rising IV helps because the ATM long call has higher vega than the OTM short call.
- At the short strike: T+0 is below expiration. Profits grow as time passes (positive theta). Falling IV helps because the ATM short call loses more extrinsic value than the ITM long call.
A common claim is that “debit spreads are ideal when IV is low,” implying rising IV helps. This is misleading. If the stock moves in your favor toward the short strike, you want IV to fall, not rise. Rising IV only benefits debit spreads when the stock isn’t moving your way.
Time Decay
Unlike a naked long call, a bull call spread has partially offsetting theta. The short call decays in your favor while the long call decays against you.
When the stock is near the long strike, net theta is negative, and time works against you. As the stock approaches the short strike, net theta flips positive, and time works for you.
This makes bull call spreads more forgiving than naked long calls if the stock stagnates.
Choosing Strike Prices
Strike selection affects cost, risk/reward, breakeven, and probability of profit.
Consider three $10-wide call spreads on a $100 stock with 30 DTE and 25% IV:
| Spread | Net Debit | Max Loss | Max Profit | Breakeven | Max Return |
|---|---|---|---|---|---|
| 90/100 (ITM) | $7.49 | $749 | $251 | $97.49 (−2.5%) | 33.5% |
| 95/105 (ATM) | $5.08 | $508 | $492 | $100.08 (+0.1%) | 96.9% |
| 100/110 (OTM) | $2.70 | $270 | $730 | $102.70 (+2.7%) | 270% |
The ITM spread costs the most, but has the lowest breakeven: the stock can fall 2.5% and the position will break even. The max return is 33.5%, risking $749 to make $251. The spread hits max profit if the stock stays flat through expiration.
The OTM spread costs the least, but has the highest breakeven: the stock must rise 2.7% by expiration. The max return is 270%, risking $270 to make $730. The spread hits max profit if the stock is up 10%+ at expiration.
Key Insight: Pushing strikes further OTM increases risk/reward, but raises the breakeven and lowers the probability of profit.
-
ITM Spreads: higher probability, lower payoff.
-
OTM Spreads: lower probability, higher payoff.
Use the bull call spread calculator to model different strike combinations.
Choosing an Expiration
A bull call spread’s max profit occurs when both options lose all extrinsic value, typically at expiration. This means even when a spread is fully ITM, you won’t see the max profit until time decay does its work.
Shorter-Term Spreads: When the spread goes ITM, theta flips positive and works quickly in your favor. You’ll approach max profit faster.
Longer-Term Spreads: Even when fully ITM, most of the max profit is locked up in extrinsic value. You’ll either wait months for time decay or need the stock to move significantly higher.
Consider a 27 DTE 450/470 call spread on TSLA at $450. If TSLA moves to $490 immediately after entry:
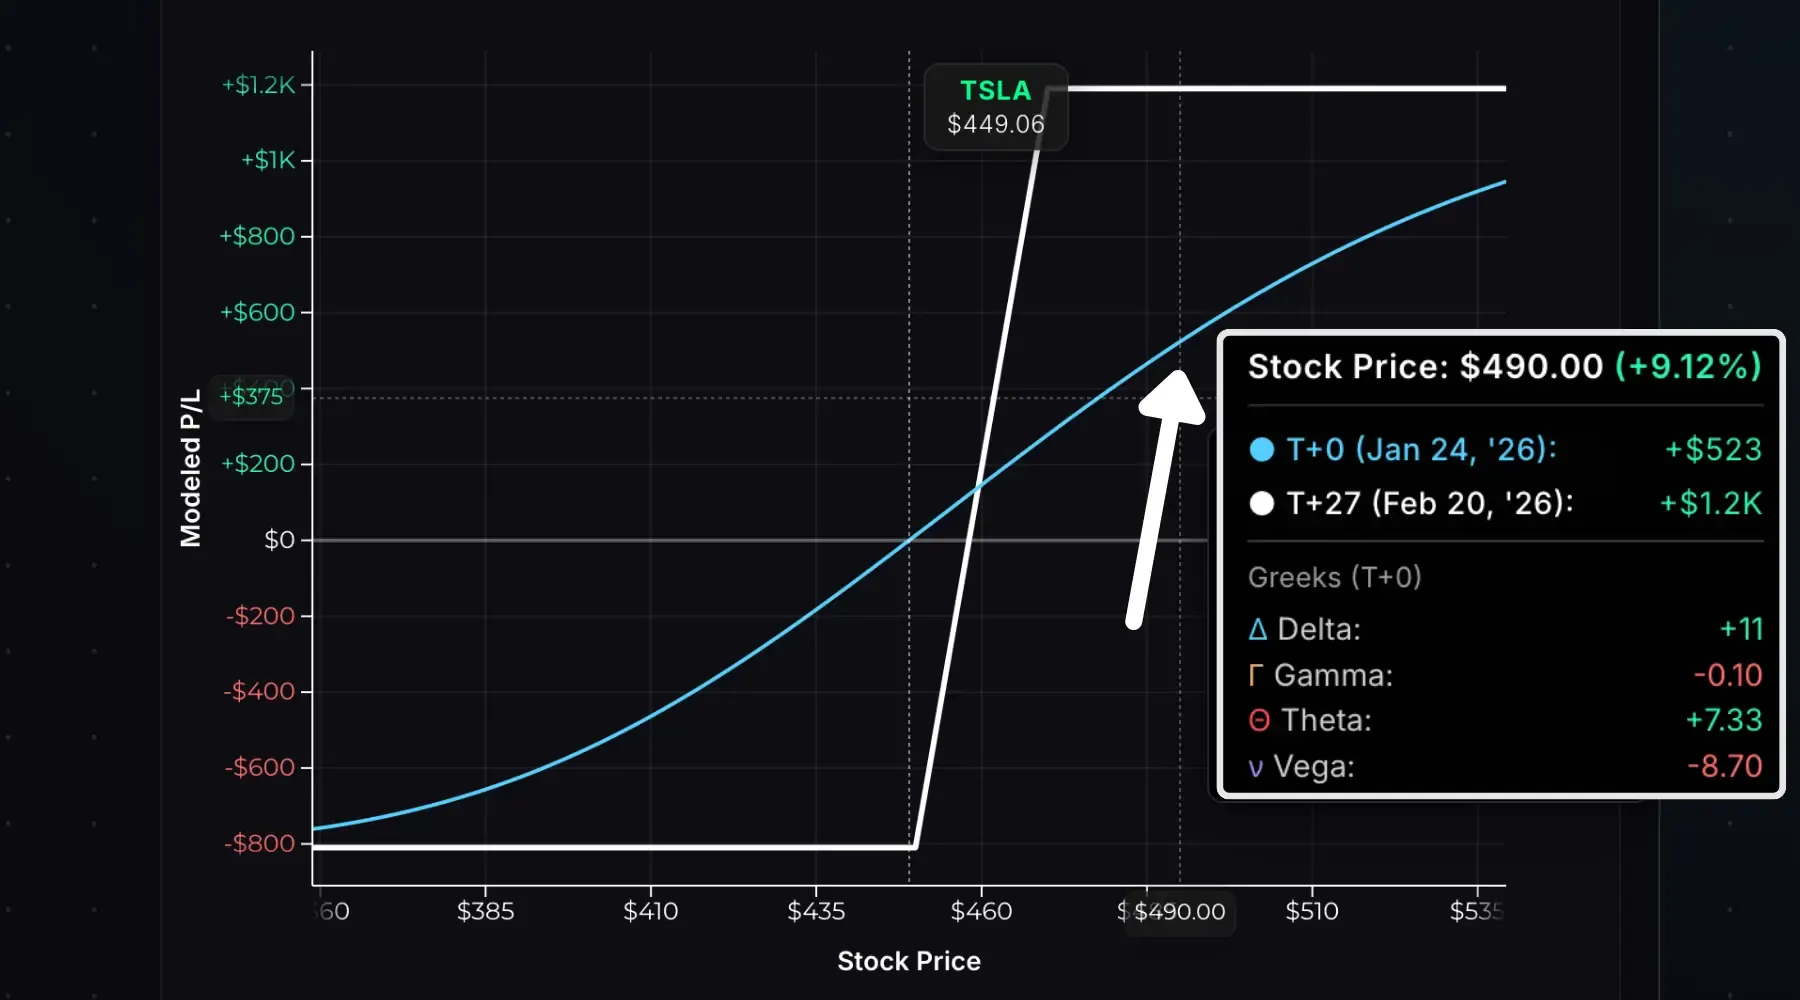
The spread shows a +$523 profit with theta at +7.33, 44% of max profit and $7.33 of positive daily decay.
Now consider the same 450/470 call spread, but with 174 DTE:
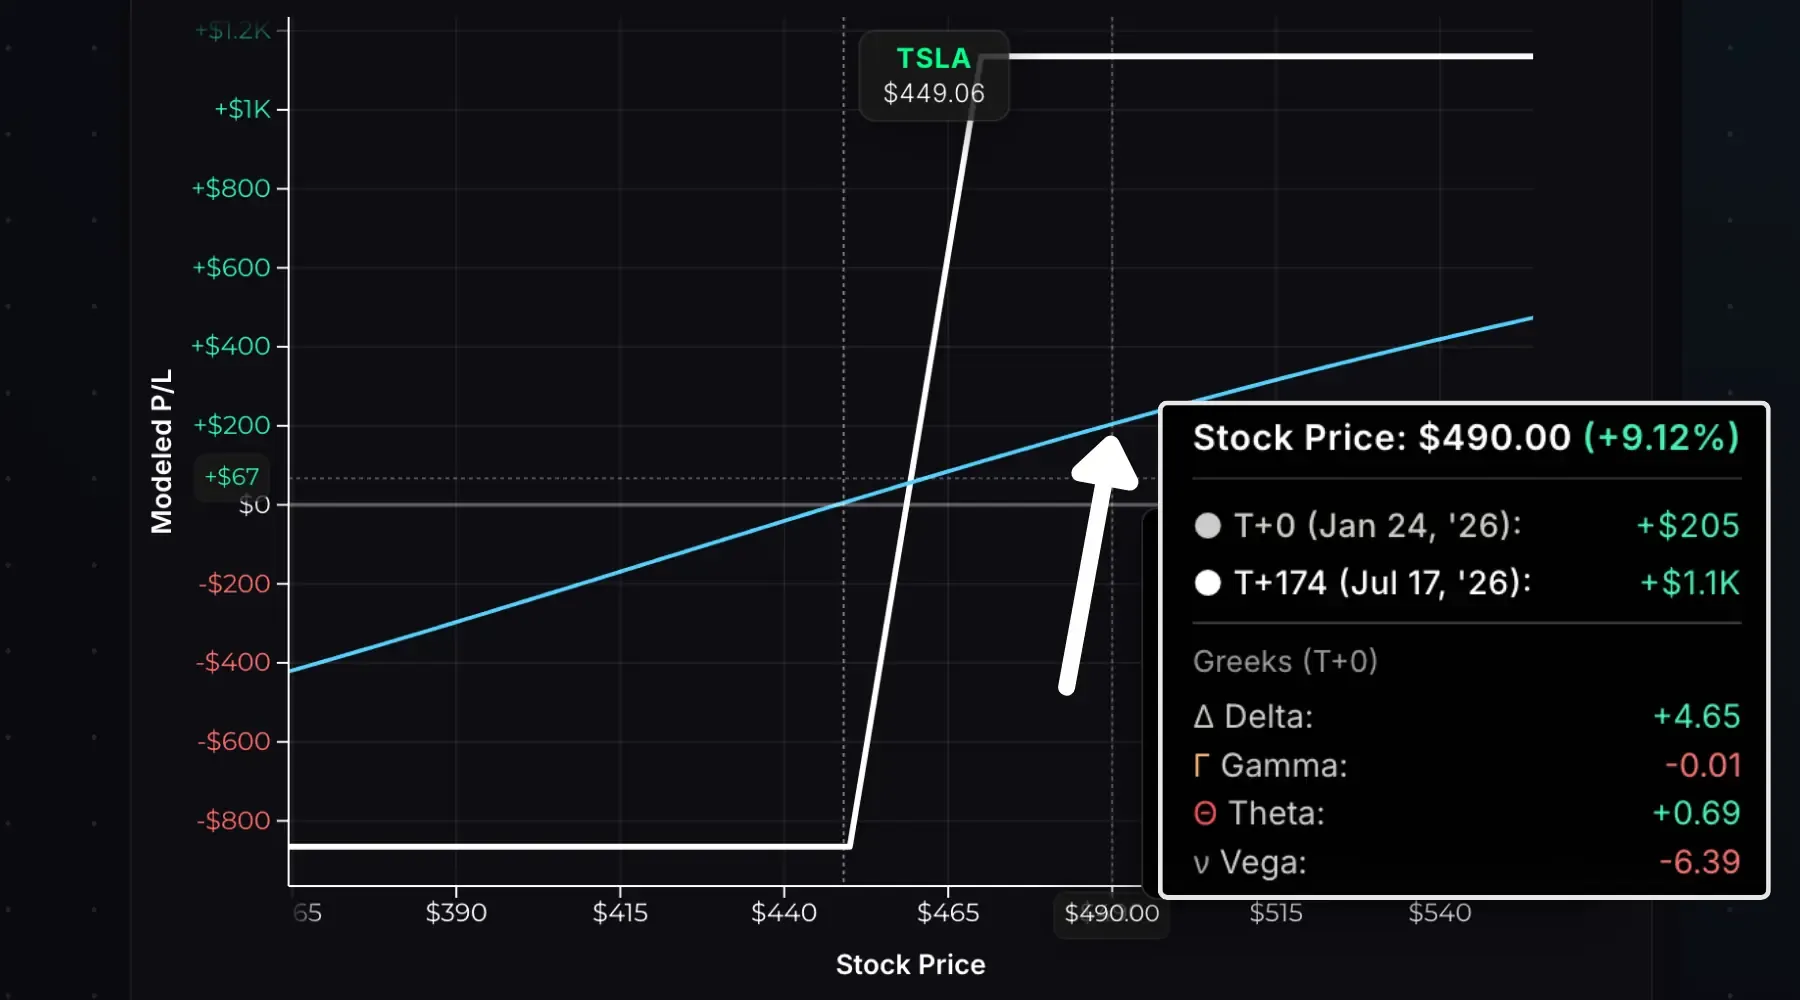
Same strikes, same $40 move, but only $205 in profit with theta at +0.69. Time decay barely helps.
| Metric | 27 DTE Spread | 174 DTE Spread |
|---|---|---|
| Modeled Profit | +$523 | +$205 |
| % of Max Profit | 44% | 19% |
| Theta | +7.33 | +0.69 |
The 27 DTE spread captured 44% of max profit; the 174 DTE spread captured only 19%. Longer-term traders with fully ITM call spreads must wait months before seeing max profit, and that’s if the spread remains ITM.
Long Call vs Bull Call Spread
A call spread costs less than a naked call using the same long strike price, and that lower cost dramatically improves the return profile.
Consider a $100 stock:
| Position | Entry Cost | Breakeven |
|---|---|---|
| Long 100 Call | $7.50 | $107.50 (+7.5%) |
| Long 100/110 Call Spread | $4.00 | $104.00 (+4.0%) |
The spread costs less and has a lower breakeven. Here’s what that means for the return profile of the spread vs. naked call:
| Stock Price | Call Profit | Spread Profit | Call Return | Spread Return |
|---|---|---|---|---|
| $100 | −$7.50 | −$4.00 | −100% | −100% |
| $104 | −$3.50 | $0 | −47% | 0% |
| $107.50 | $0 | +$3.50 | 0% | +88% |
| $110 | +$2.50 | +$6.00 | +33% | +150% |
| $115 | +$7.50 | +$6.00 | +100% | +150% |
| $120 | +$12.50 | +$6.00 | +167% | +150% |
Green highlights show the winning trades at each stock price.
At $110 (a 10% move higher), the long call returns 33% while the spread returns 150%.
Key Insight: The spread outperforms the long call unless the stock moves explosively (20%+ in this case). For most bullish scenarios, the spread wins on capital efficiency.
Early Assignment
The short call in your spread can be assigned early, but this isn’t a concern for bull call spreads. If your short call is assigned, the spread is already at or near max profit. You simply exercise your long call to cover, locking in the spread width. Or, sell the long call and short stock in the same closing transaction to unwind the trade.
Entry, Exit, and Expiration
To enter: Place a spread order to buy the lower strike call and sell the higher strike call simultaneously. You’ll pay a debit to enter the trade.
To exit before expiration: Close the spread by selling the long call and buying back the short call as a single spread order. You’ll receive a credit when exiting the trade.
If you hold the spread through expiration:
| Scenario | Stock Price | Result |
|---|---|---|
| Both OTM | ≤ Long strike | Both expire worthless. Max loss. |
| Partially ITM | Between strikes | Long call exercises, short expires. You own 100 shares per call. |
| Fully ITM | ≥ Short strike | Long exercised and short assigned, net zero shares. Max profit. |
Using a 100/110 call spread entered for $4.00:
- Stock at $95: Both calls expire worthless. You lose the $400 entry cost.
- Stock at $105: Long call auto-exercises (buy shares at $100). Short call expires. You own 100 shares at a $104 cost basis (long strike + debit).
- Stock at $115: Long call auto-exercises, short call gets assigned. You buy 100 shares at $100 and sell at $110, a $1,000 gain on the shares, minus the $400 entry cost = $600 net profit.
Avoid the partially ITM scenario. If your long call exercises while the short expires worthless, you’ll own shares, creating significant downside risk instead of the defined-risk spread you started with.
- A bull call spread is a moderately bullish strategy with defined risk and limited profit potential.
- Max loss = net debit × 100 × number of spreads. Max profit = (spread width − net debit) × 100 × number of spreads. Breakeven = long call strike + net debit.
- Gamma, theta, and vega flip as the stock moves from the long strike to the short strike.
- ITM spreads have higher probability but lower reward; OTM spreads have lower probability but higher reward.
- Bull call spreads outperform long calls return-wise unless the stock moves explosively higher.
- Early assignment on the short call isn’t a problem. Exercise your long call and receive the spread width (max profit achieved).
Related Guides
- What Is a Long Call?: The building block of this strategy
- What Is a Bull Put Spread?: Credit spread alternative
- What Is a Bear Call Spread?: Bearish credit spread counterpart
- What Is Delta?: How option prices change with the stock price
- What Is Theta?: Understanding time decay
Ready to model your own spreads? Use our Bull Call Spread Calculator to visualize P/L for any strike combination.