What Is the Wheel Options Strategy?
How to trade the wheel strategy step-by-step: cash-secured puts, covered calls, and a full example.
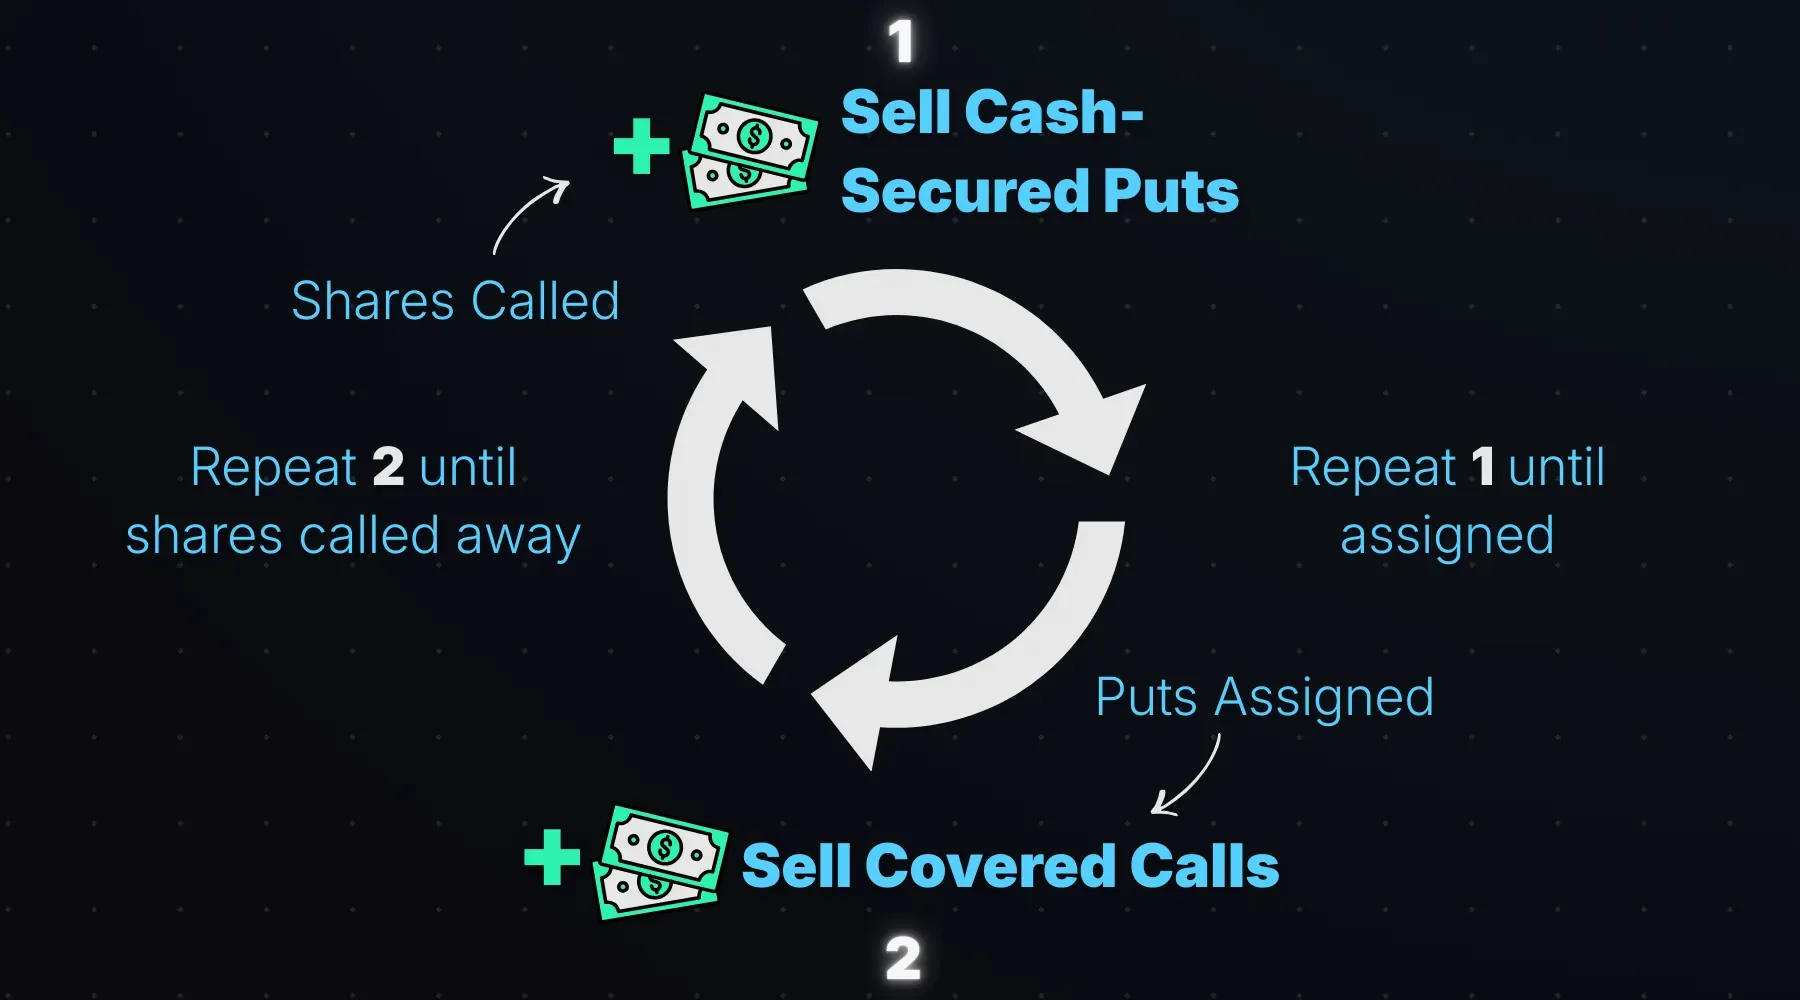
The wheel is a repeating options strategy that generates income by selling cash-secured puts until you’re assigned shares, then selling covered calls until those shares are called away. You collect premium at every step. When the shares get called away, you start over: hence the name “wheel.” It just keeps on turning.
The strategy is grounded on the idea of owning shares, which makes it arguably more conservative and higher-probability than most options strategies. You’re not speculating on direction with leveraged bets. You’re collecting premium while waiting to buy a stock you want to own, then collecting more premium while holding the shares.
The wheel cycles between two positions:
- Selling puts: collecting premium while waiting to buy shares at a price you like
- Selling calls: collecting premium while waiting to sell shares at a price you like
You stay in each position as long as your options expire OTM. Assignment moves you from puts to stock ownership. Getting called away moves you back to puts. The “wheel” is this continuous rotation between the two.
Selling Cash-Secured Puts
A cash-secured put (CSP) means you sell a put option and keep enough cash in your account to buy 100 shares if assigned. You’re getting paid while waiting to buy stock at a lower price. Learn more in the complete guide to cash-secured puts.
Selling a CSP is actually more conservative than buying stock outright. You collect premium upfront, which lowers your effective purchase price if assigned and provides a buffer that owning shares doesn’t have.
Example: CSP vs. Buying Stock
Stock is at $100. You sell a 95-strike put for $5.00, collecting $500. You set aside $9,500 in cash, enough to buy 100 shares at $95 if assigned. This is the “cash-secured” part.
Compare that to buying 100 shares at $100. You’d need $10,000 and your max loss is $10,000. The CSP requires less capital and has less downside.
If the stock stays above $95, you keep the $500 and never buy anything. If assigned, your cost basis is $90 (strike minus premium), 10% below where the stock was trading when you entered.
I used the cash-secured put calculator to generate the following payoff diagram:
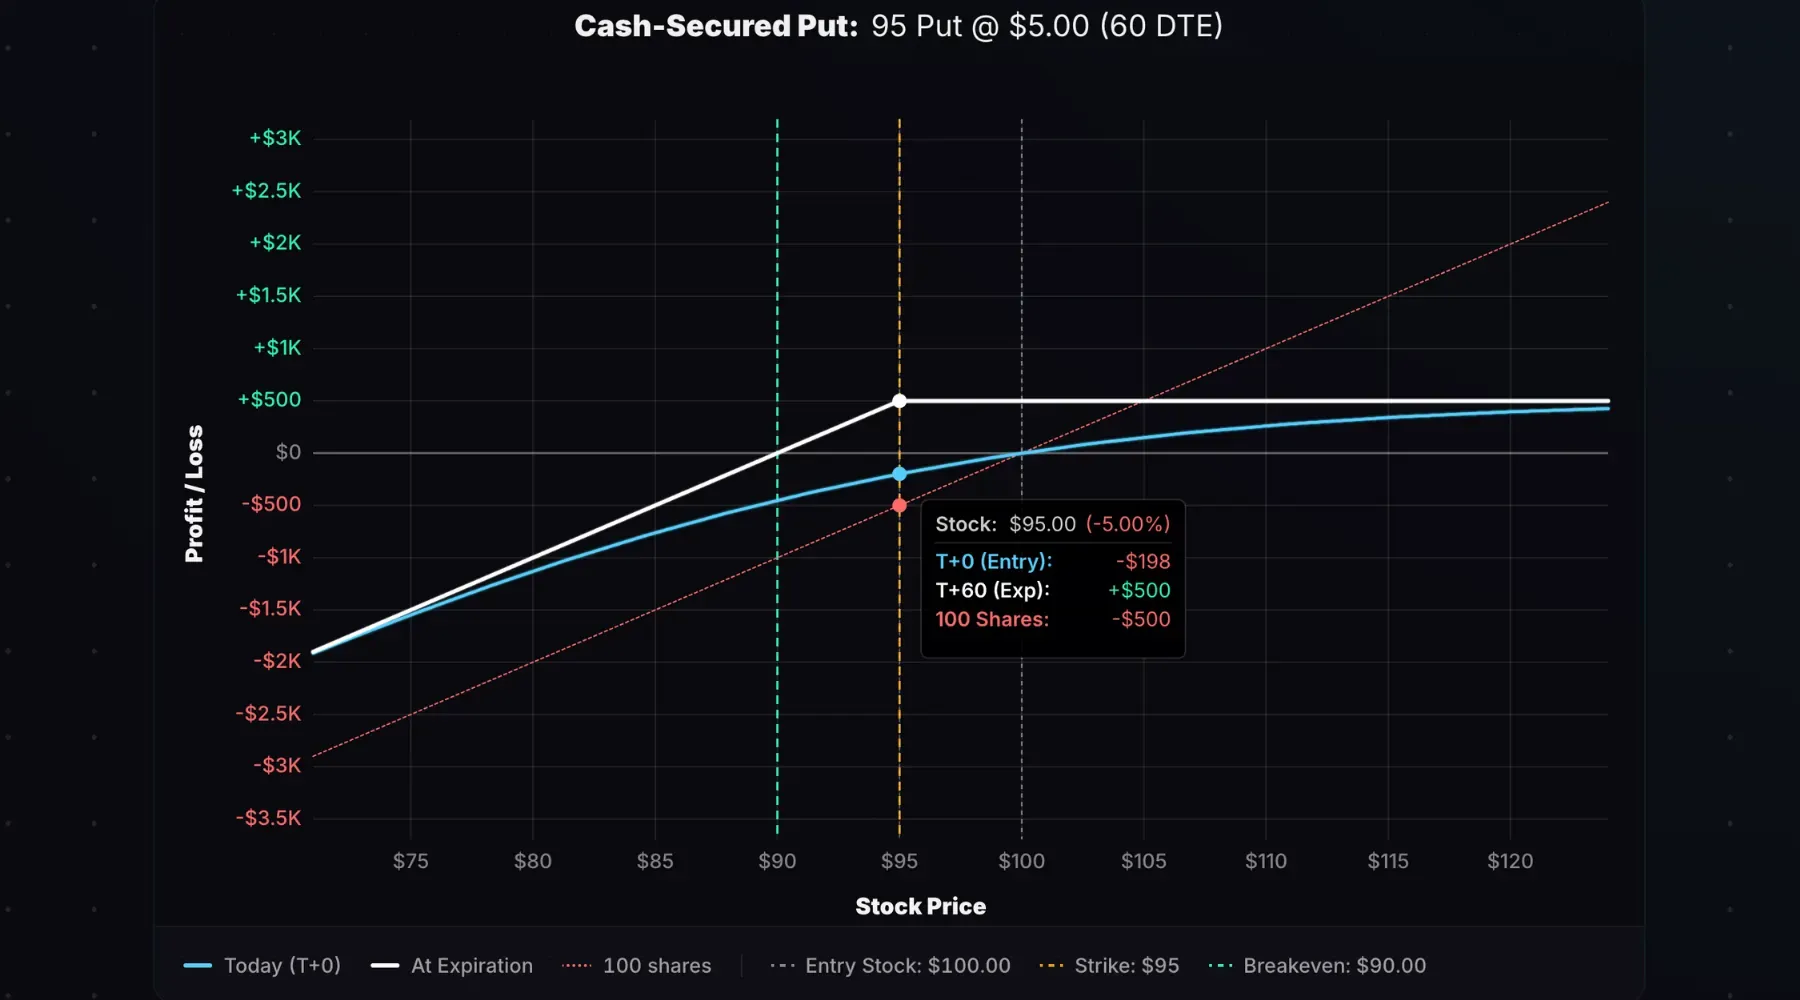
The stock P/L line sits below the CSP expiration line at every price below the entry stock price. That gap is the $500 buffer the premium gives you. At $95, the stock position is down $500, but the 95 short put would have a profit of +$500 since it would expire worthless.
Trading a cash-secured put is much different from a speculative naked put, where you sell puts without the cash to back it up. A naked put uses margin and carries significantly more risk: if the stock drops hard, you could face a margin call or be forced to close at a big loss. And you won’t have any shares of stock to profit from a share price recovery. With a cash-secured put, you’re fully prepared to take delivery of the shares. No surprises.
The Key Decisions
Strike selection:
- ATM (at-the-money): More aggressive. You collect more premium but have less downside buffer before assignment. This is a more bullish stance.
- OTM (out-of-the-money): Less aggressive. You collect less premium but have more cushion before assignment. This is a less aggressively bullish stance. You’re giving the stock price a lot of downside room for you to still profit.
The two metrics panels show the differences between selling a 100 put vs. 90 put on a $100 stock:
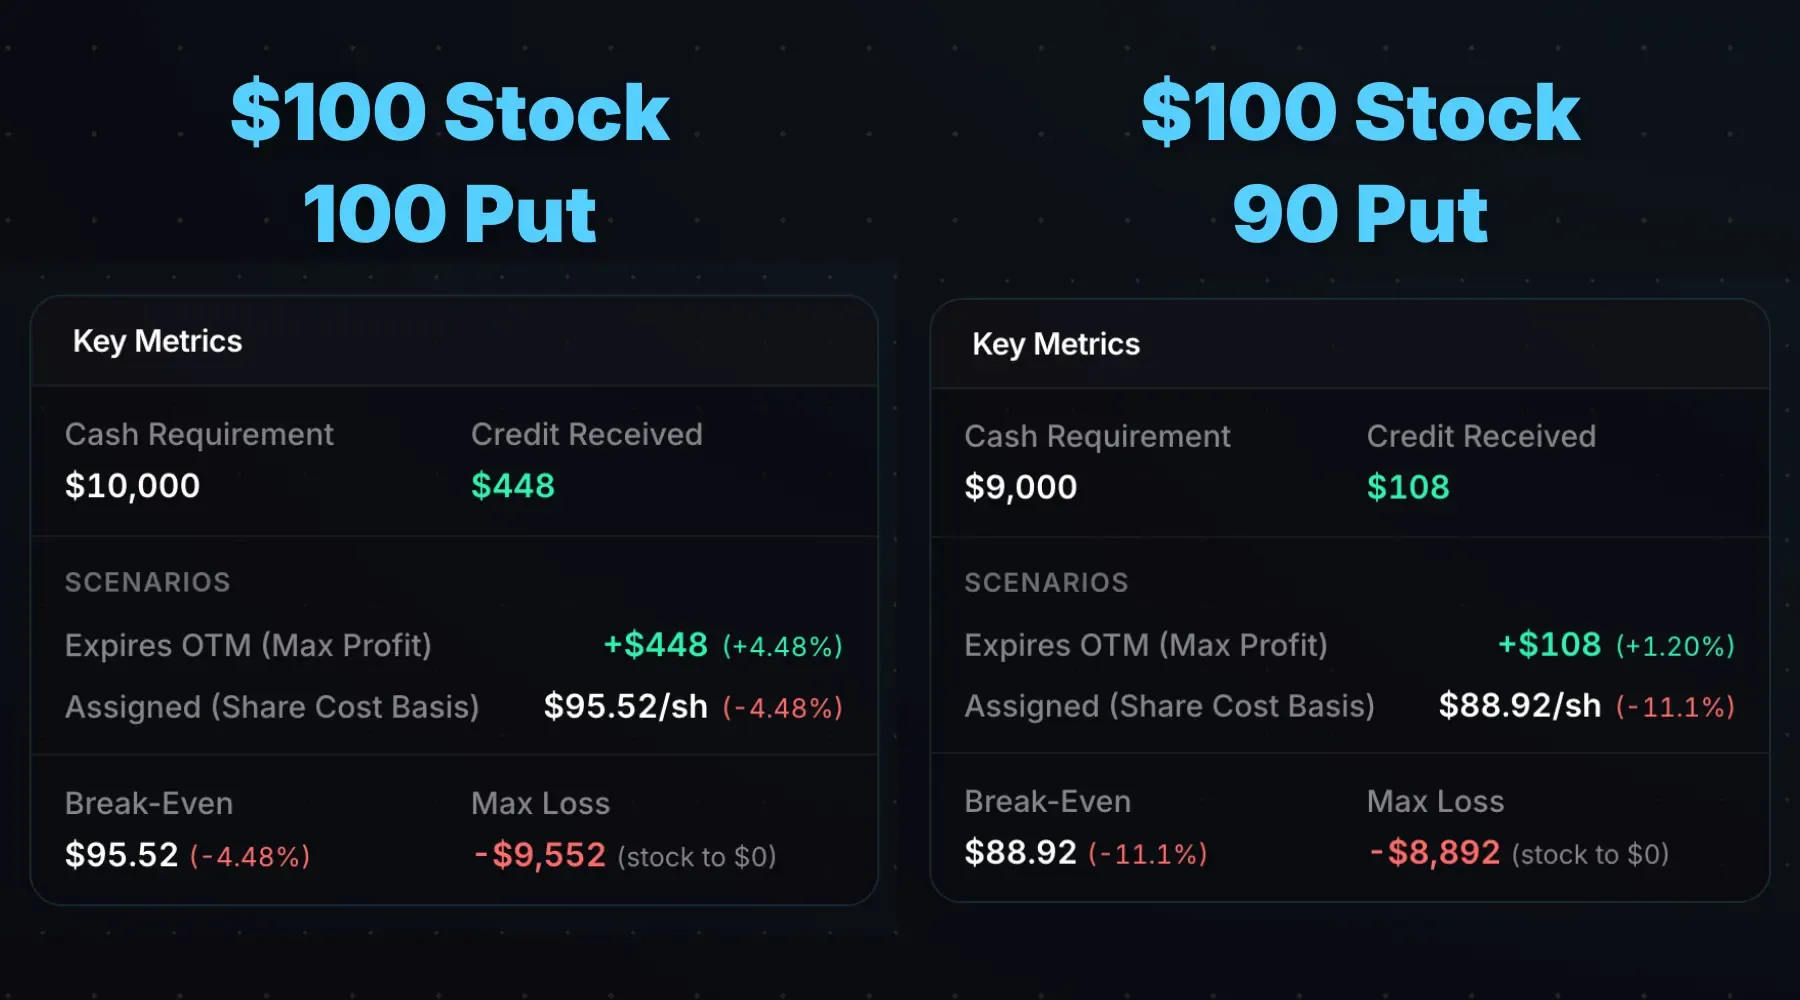
Stock at $100, 60 Days to Expiration (DTE), 30% Implied Volatility (IV)
The 100 put collects $448, has a cash requirement of $10,000, and an effective cost basis of $95.52 if assigned. If the stock remains flat at $100, the return on capital is +4.48%. The 90 put collects $108, has a cash requirement of $9,000, and an effective cost basis of $88.92 if assigned. But if the stock stays flat at $100, the return on capital is only +1.2%.
Selling the deep OTM put has less risk and a higher probability of profit, but less reward if the stock stays flat or appreciates. Selling ATM puts is more aggressive directionally with more reward potential, but a higher breakeven and lower probability of profit.
Expiration: 30–60 DTE is a common window.
Managing CSPs
Close at 50–80% of max profit: If you sold a put for $2.00 and it’s now worth $0.50, you’ve captured 75% of the premium. Close it and move on.
Closing sooner than 50% of max profit means a higher probability of profit, but you’re cutting off your reward quickly after taking on the risk of the trade. Closing later than 80% and you’re squeezing pennies while holding an option with little time decay left to capture. The sweet spot is somewhere in the middle. Once you close, you can sell another put, potentially at a higher strike or further out in time.
Rolling: If the stock drops toward your strike, you can roll the put out in time (and possibly down in strike) for a net credit. This extends the trade, collects more premium, and gives the stock more time to recover.
Ideally, you roll out (and maybe down) for a decent credit. If you’re rolling for a scratch (you buy back your short put for $5.00 and sell the next one for $5.00), you’re extending the trade without adding any profit potential. At that point, it probably isn’t worth it.
Also worth noting: the point of the wheel is to potentially take assignment. Rolling aggressively to avoid assignment kind of defeats the strategy. If you can’t roll for a meaningful credit, let assignment happen and move to the covered call phase.
Selling Covered Calls
Once you’re assigned shares, you switch to selling covered calls. You own 100 shares and sell someone the right to buy them from you at a higher price. You collect premium while you wait.
When to Start Selling Calls
You just got assigned, which means the stock dipped. You have a choice:
If you expect a strong recovery, hold off on selling calls. You don’t want to cap your upside right before a bounce. If you wait for even a small recovery, say a few percent, the call you sell will be at a much more favorable price. You’ll get a higher premium at the same strike, or potentially a higher strike for the same premium. You’re locking in a better overall position by being patient.
If you expect sideways or gradual movement, start selling calls immediately to collect premium while you wait.
There’s no perfect answer. It depends on your read on the stock.
The Key Decisions
Strike selection: Sell calls at or above your cost basis. Ideally, sell at or above your original put strike. This ensures that if you get called away, the stock sale combined with your premiums results in a profit.
Expiration: 30–60 DTE, same logic as puts. You can go shorter (weekly) for more frequent premium collection, but you’ll have to sell call strikes much closer to the stock price to get any decent premium. 30–60 DTE is a sweet spot where you can collect juicier premiums while selling strikes further from the current price. You also avoid locking yourself into one strike for a prolonged period.
Use the covered call calculator to visualize P/L for any covered call setup.
Managing Covered Calls
If the stock stays below your strike: The call expires worthless. Keep the premium, sell another call. Repeat until the shares get called away.
If the stock blows past your strike: You have choices. Let the shares get called away and take your profit. Or roll the call up and out for a credit to capture more upside. This can make sense if you can collect a good enough premium.
But if you think the stock might dip after the rally, letting the shares get called away and then selling OTM puts could be the better play. You’d re-enter at a lower price if assigned again.
If you want to be mechanical about it, just let the shares get called away and follow a “no-touch” wheel approach: sell options, take assignment if they expire ITM, and don’t try to optimize every move.
If the stock drops: Your short call’s price will fall. You can close it early for a profit and sell another one at a lower strike (but still above your cost basis), or wait for expiration and reassess.
The Ideal Environment for the Wheel
The wheel is a bullish strategy. It profits from a rising stock price, just not a rapidly rising one.
Like any capped-upside strategy, it’s not ideal to see the stock rally significantly. You’ll miss out on gains compared to just buying the stock in the first place. But you’ll still make money. This is a bullish strategy after all. Making money while “underperforming” isn’t really a bad outcome.
Ideal scenario: Never getting assigned in the first place. This could mean the stock stays flat or drifts higher over time: your puts keep expiring OTM and you keep collecting premium. Or, if you do get assigned, seeing successive calls expire OTM without a loss on your shares. You keep accumulating profits from selling options and outperform the equity on its own.
The trade-off vs. owning stock: If the stock rallies hard right after you sell a put, your profit is capped at the premium collected. The stock would have captured more upside. Same thing if you’re long shares and selling calls: a big move up means you’re called away and miss the rest of the rally.
The sweet spot: Bullish trend, moderate pace. The wheel underperforms in a face-ripper rally and gets hurt in a sustained downtrend. It shines in a grinding, choppy, or slowly rising market where premium collection adds up over time.
Wheel Example with P/L Breakdown
Let’s walk through a complete wheel cycle on a hypothetical stock trading at $100.
Step 1: Sell a Cash-Secured Put
- Stock price: $100
- Sell: $100 put, 45 DTE
- Premium collected: $4.00 ($400)
- Cash reserve: $10,000
The stock drifts up to $103 over 30 days. Your put is now worth $1.00. You close it for a $300 net profit (collected $400, paid $100 to close).
Running credits: +$300
Step 2: Sell Another Put
- Stock price: $103
- Sell: $100 put, 45 DTE
- Premium collected: $3.00 ($300)
The stock drops to $97. Your put is ITM at expiration. You get assigned 100 shares at $100.
You bought 100 shares at $100/share for $10,000. But you’ve collected $600 in net premiums along the way ($300 from the first put + $300 from this one).
Running credits: +$600
Cost basis: $10,000 − $600 = $9,400 ($94.00/share)
Step 3: Sell a Covered Call
- Stock price: $97
- Your cost basis: $94.00
- Sell: $100 call, 30 DTE
- Premium collected: $2.00 ($200)
The stock stays flat at $98. Your call expires worthless. You keep the $200.
Running credits: +$800
Cost basis: $10,000 − $800 = $9,200 ($92.00/share)
Step 4: Sell Another Covered Call
- Stock price: $98
- Your cost basis: $92.00
- Sell: $100 call, 30 DTE
- Premium collected: $2.50 ($250)
The stock bounces to $102. Your call is ITM at expiration. Shares get called away at $100.
Running credits: +$1,050
P/L Summary
Option credits: +$1,050
Stock purchase: $10,000 (bought at $100)
Stock sale: $10,000 (sold at $100)
Stock P/L: $0
Total P/L: +$1,050
That’s a 10.5% return on $10,000 cash reserve over roughly 4 months, all from premium collection. The stock ended at $102 for a $200 gain on 100 shares, but the wheel strategy made $1,050.
Compared to Buy-and-Hold
If you had simply bought 100 shares at $100 at the start:
- Entry: $10,000
- Exit: $10,200 (stock at $102)
- P/L: $200
The wheel turned a small buy-and-hold win into a larger $1,050 profit.
What If the Stock Rallied to $110?
Let’s replay Step 4 with a stronger move. Instead of the stock bouncing to $102, imagine it rips to $110. Your $100 call is deep ITM. Shares get called away at $100.
Buy-and-Hold P/L:
If you had simply bought 100 shares at $100 at the start and held:
- Entry: $10,000
- Exit: $11,000 (stock at $110)
- P/L: +$1,000
The wheel still wins, but barely. The wheel made $1,050 vs. $1,000 on the stock.
Now imagine the stock rallied to $115 instead. Buy-and-hold would be up $1,500. The wheel? Still $1,050. You’d have underperformed by $450.
This is the trade-off. The wheel has capped upside. When a stock grinds sideways or drifts modestly higher, the premiums you collect lead to outperformance. But when a stock melts through your call strike and keeps running, you don’t participate in the gains above that strike.
You’ll still make money. The wheel is a winning trade in this scenario. But “winning while underperforming” can sting when you watch the stock keep climbing without you.
The Wheel Strategy’s Primary Risks
The wheel has two main risks: downside and opportunity cost.
Downside Risk
The worst case is a stock that collapses and stays down.
You sell a $100 put on a $100 stock, collecting $4.00. The stock crashes to $70 on bad earnings. You get assigned at $100. Your cost basis is $96, but the stock is at $70. You’re sitting on a $2,600 unrealized loss.
Now you’re stuck. You can sell covered calls, but you need to be careful about strike selection.
Don’t sell calls below your cost basis. If your cost basis is $96 and the stock is at $70, you might be tempted to sell an $80 call to collect some premium. But if the stock rips back to $85 and your shares get called away at $80, you’ve locked in a $1,600 loss, even though the stock recovered most of the way.
Opportunity Cost
Missed gains don’t show up as explicit losses, but they’re real. Trading a capped-profit strategy consistently on a stock that’s going parabolic will result in the buy-and-hold stock far outperforming the wheel, even though both will be profitable with a rising stock.
The wheel works best on stocks with moderate upside expectations, not on high-conviction stocks where you’d regret being called away.
How to Track Wheel P/L
Calculating the P/L of a wheel trade requires keeping track of net credits from options, and net proceeds from stock purchases/sales.
The simple formula is: Net Credits from Options Trades + Net Proceeds from Stock Trades
In our earlier example, the net credits from the options trades was $1,050, while the net proceeds from the stock trades was $0 (bought the stock at $100 and sold it at $100).
Final Thoughts
I like the wheel strategy because it’s grounded in owning shares of stock. That makes it more conservative than any speculative options trading strategy.
If you get assigned on a put on a stock you actually want to own, your cost basis will be better than just buying the stock outright at the moment of entering the CSP. Both the cash-secured put and the covered call are high-probability trades when sold OTM, and the premium collected provides a buffer that stock ownership alone doesn’t have. It’s a powerful approach to adding options to a stock portfolio.
The two real risks are the downside of seeing the stock plummet, and the opportunity cost of capping your gains when the underlying stock is a big winner. In that scenario, you’ll be chasing the stock higher with the next CSP, selling puts at higher strikes and capturing less upside if the stock keeps running.
But you’ll still make money. And the premium collected along the way provides a cushion that outright ownership doesn’t.
Use our cash-secured put calculator and covered call calculator to visualize wheel trade components before entry.