Trade Options with a Clear P/L Picture
See your risk before you trade: build any options position, visualize the full P/L curve, and understand how time, implied volatility, and adjustments change your risk profile.
Who this is for
- New options traders who don't want to guess what their P/L will look like.
- Traders who know the basics and want to clearly model trades before they commit capital.
- Traders who want to quantify how adjustments and new positions change their overall risk.
See How It Works
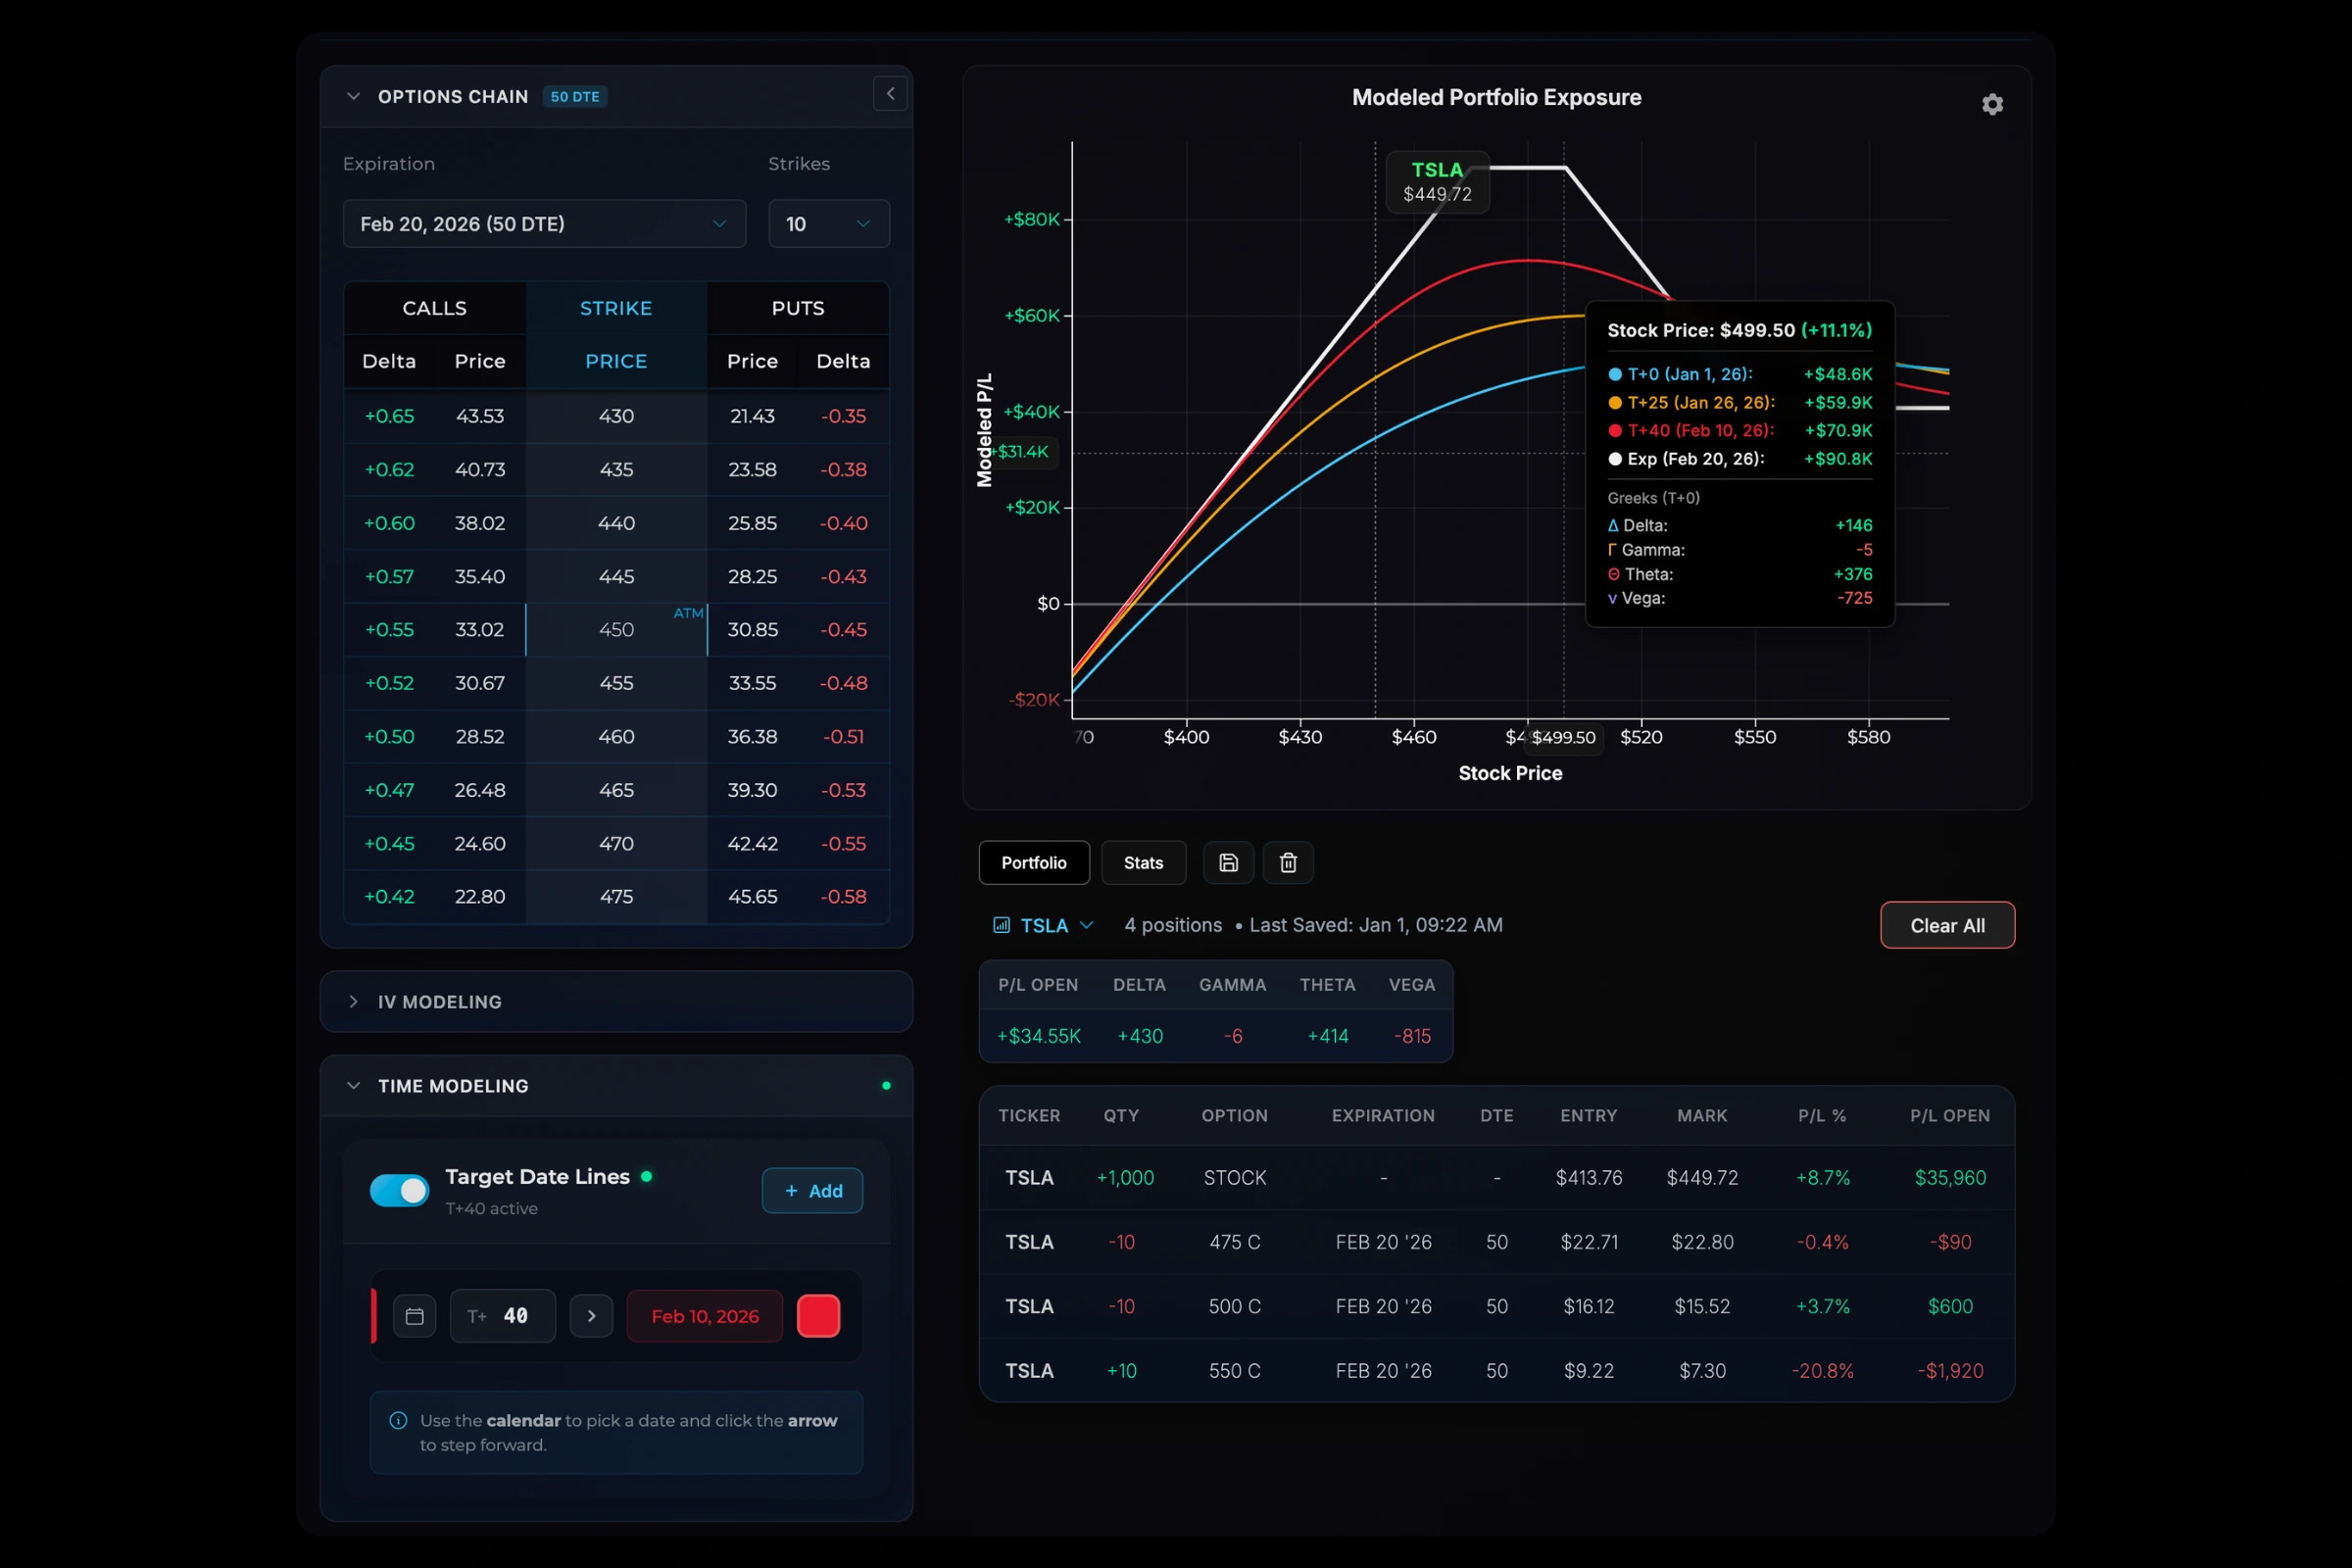
P/L Visualization
Your full position at a glance. Breakevens, profit zones, and max loss—updating live with the market.
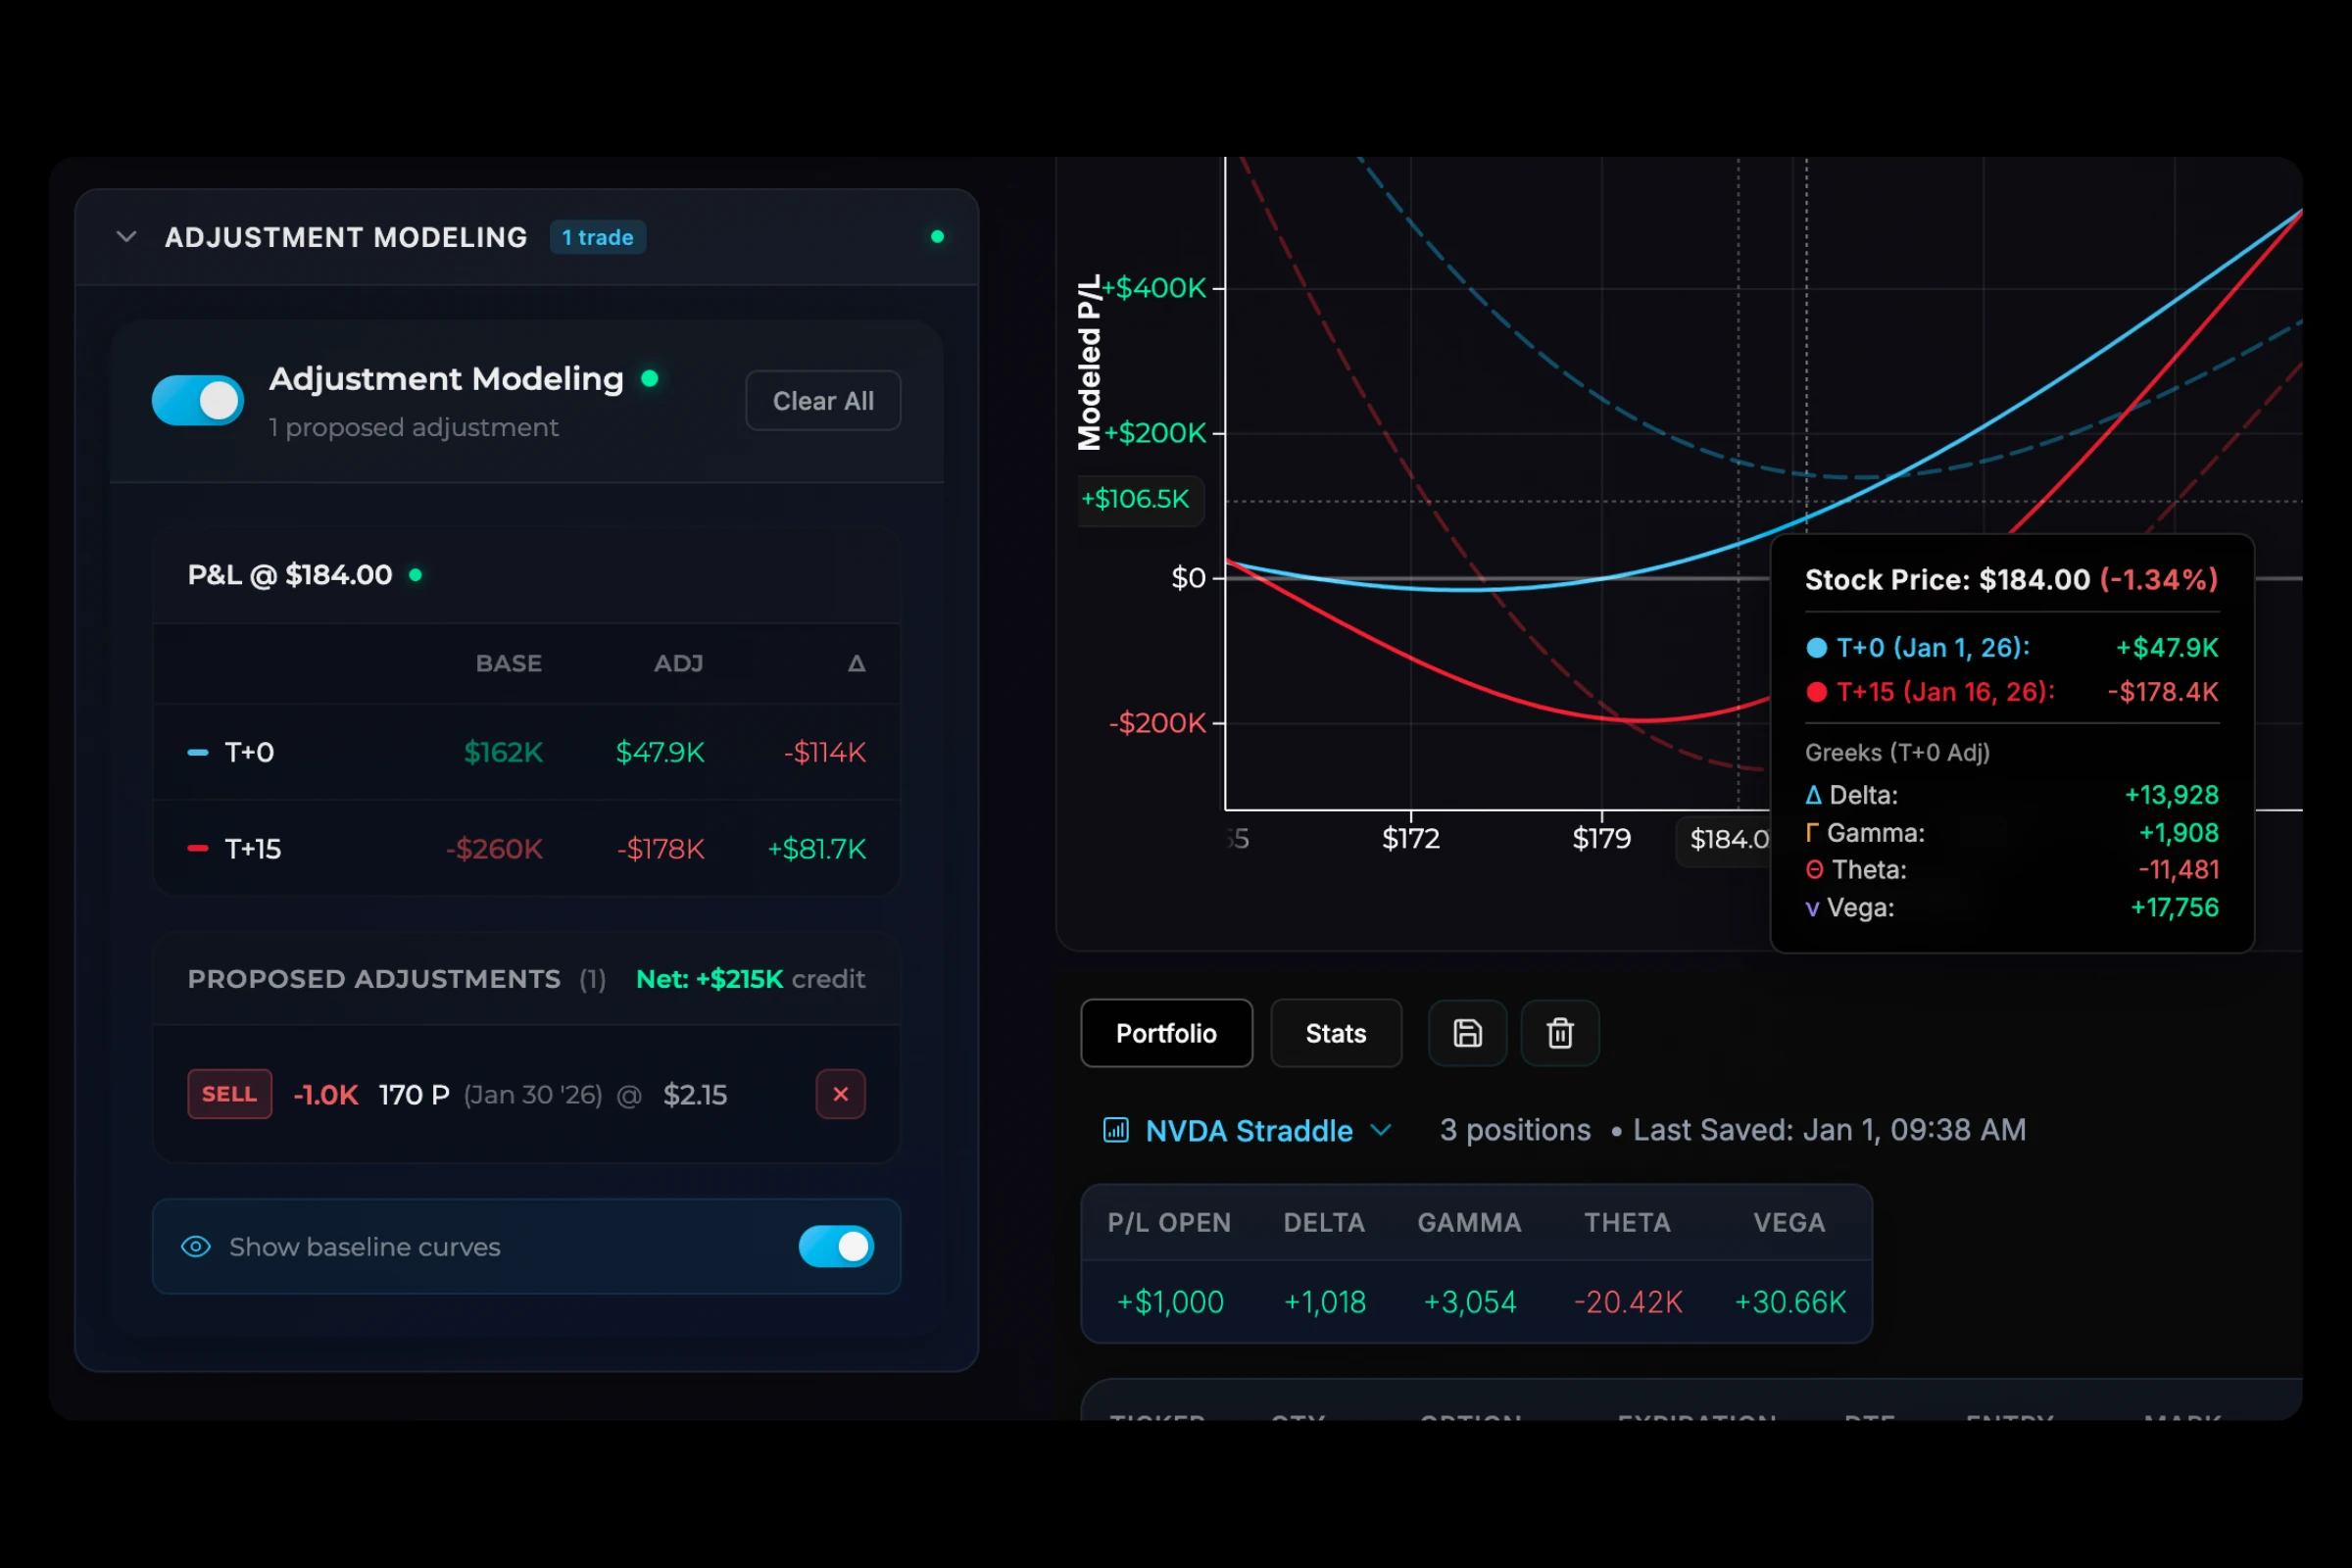
Adjustment Modeling
Add any adjustment and instantly compare current vs. adjusted P/L curves, so you can see whether the change actually improves your position for your outlook.
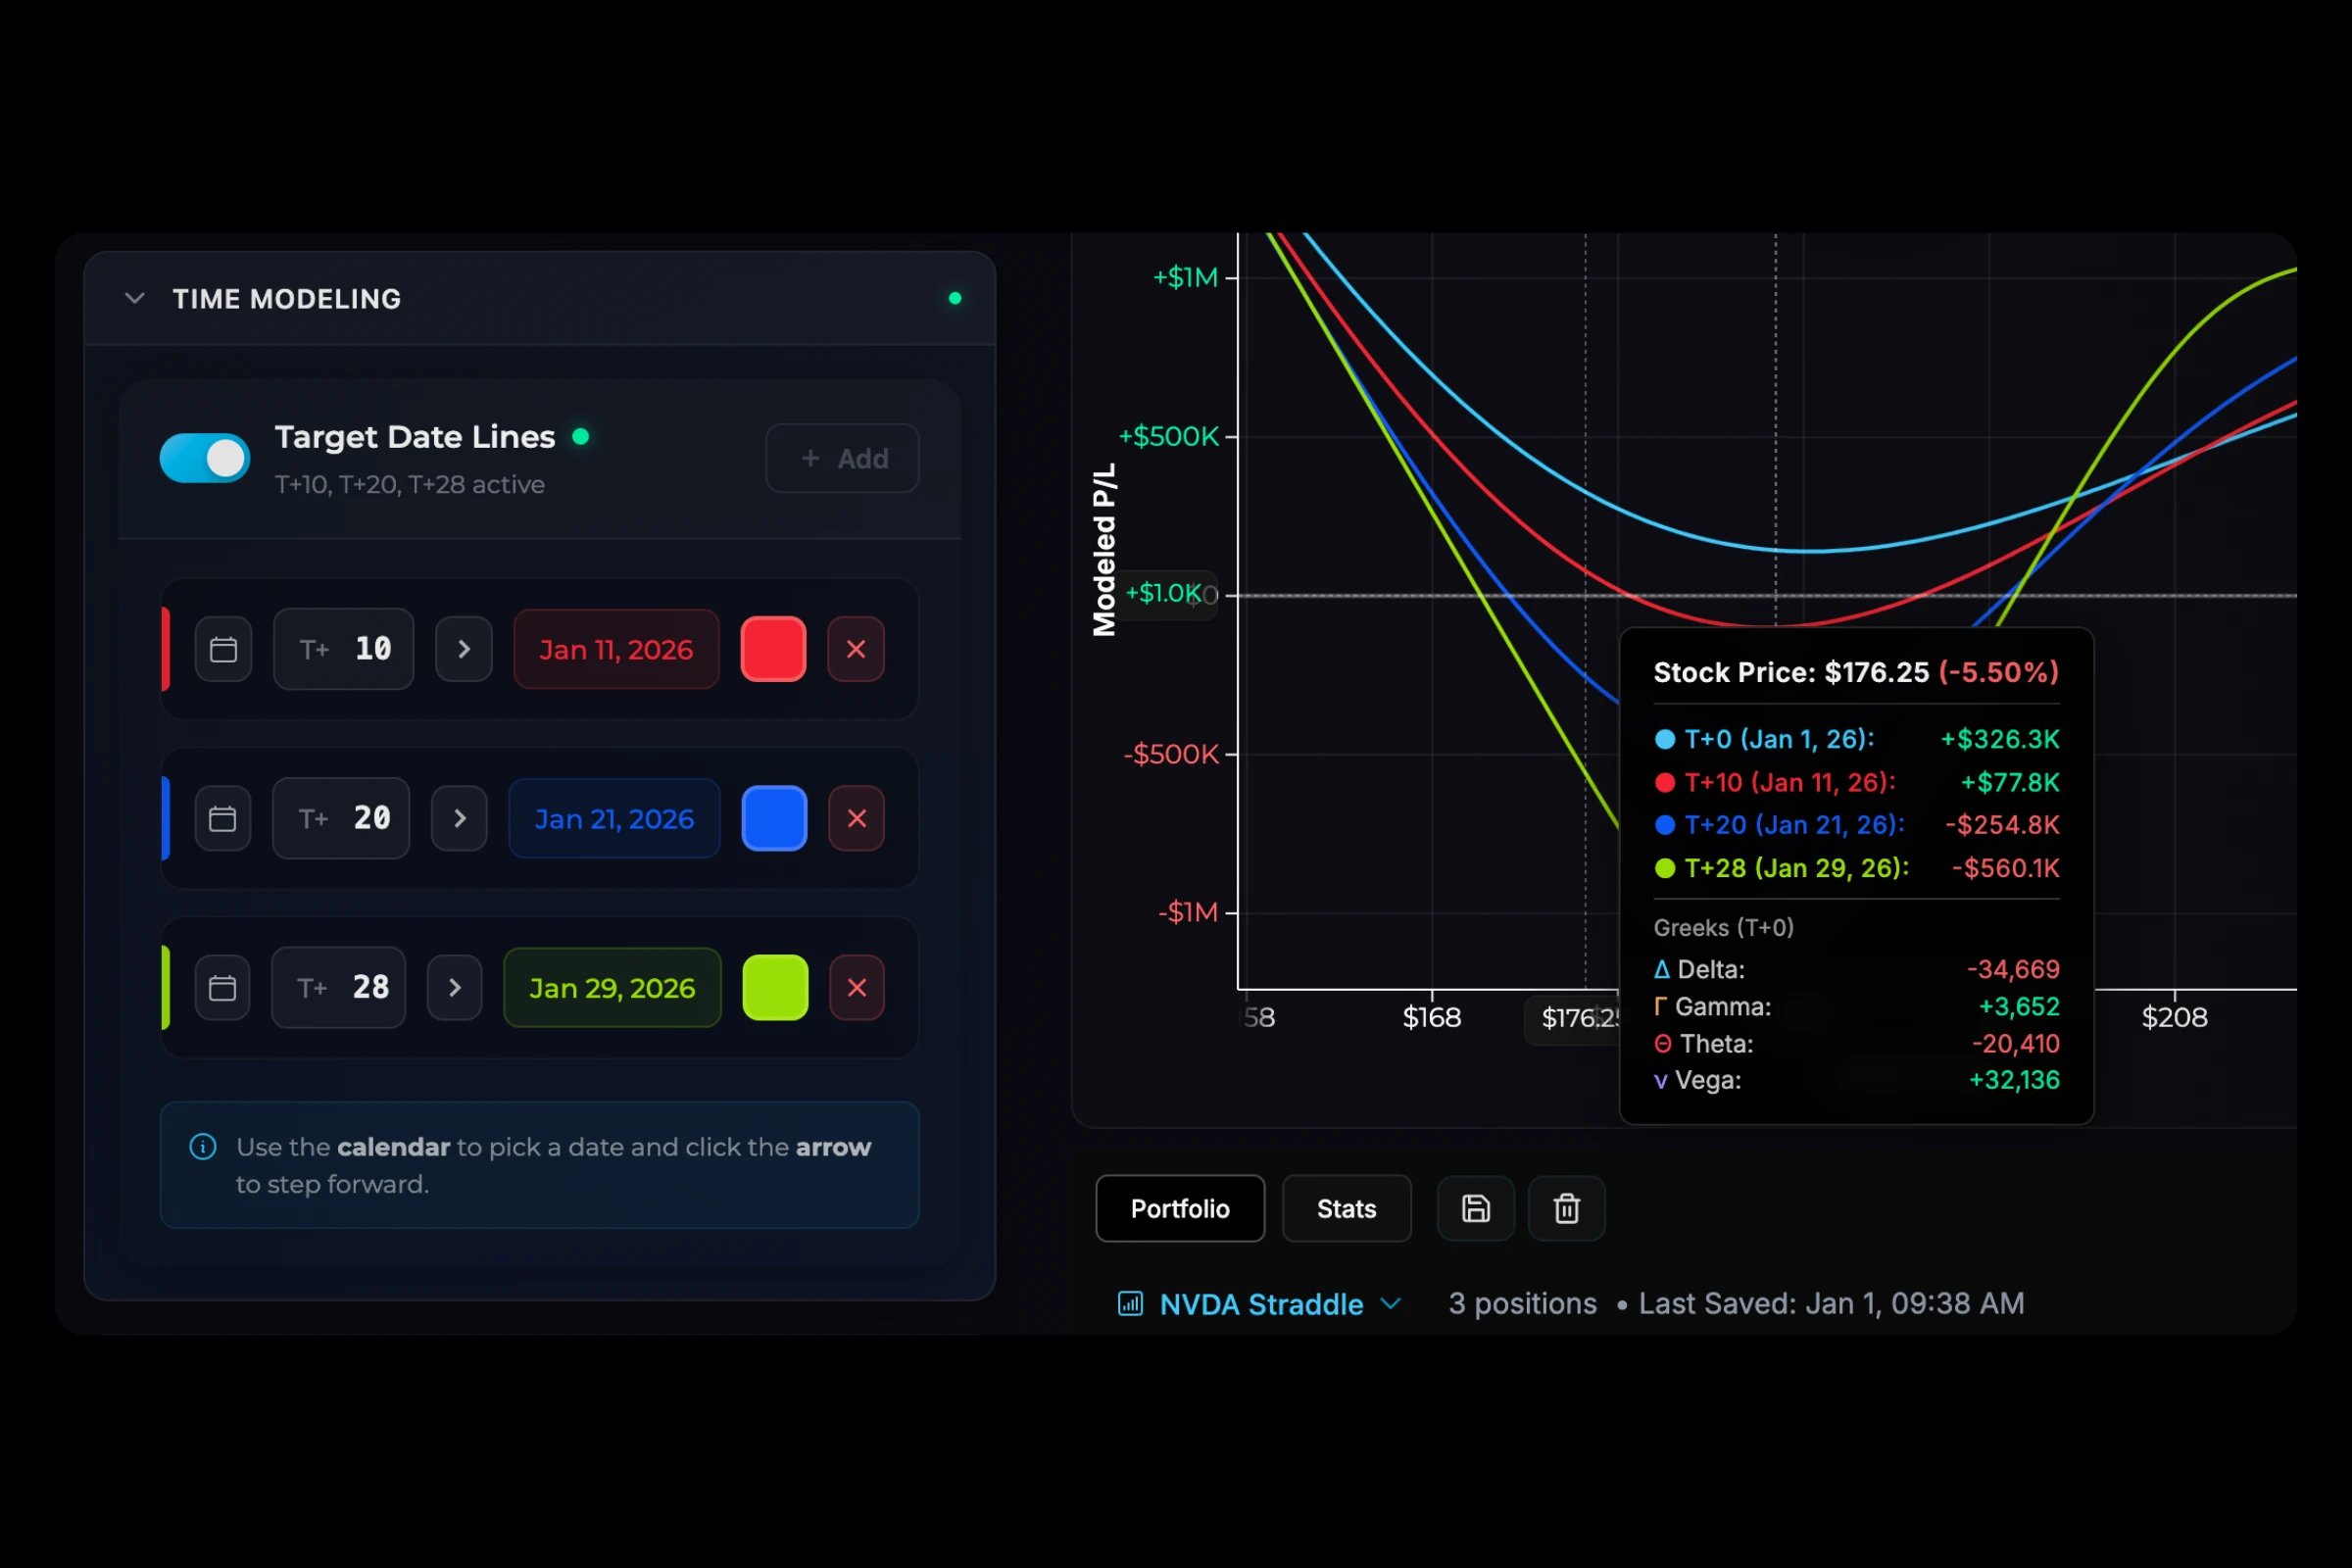
Time Decay Modeling
See how time works for or against you. T+ lines show how your P/L curve shifts as expiration approaches.
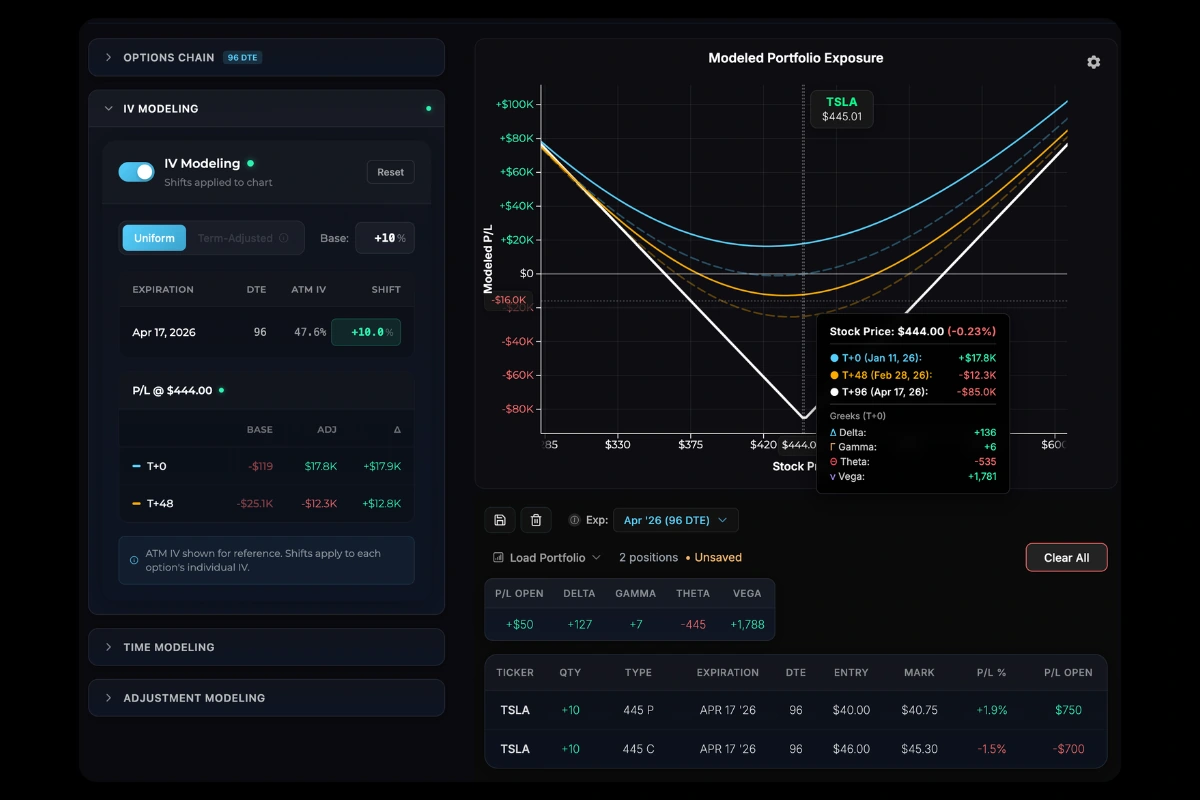
IV Modeling
Shift implied volatility up or down and see how your P/L and risk profile change if volatility spikes or collapses. Combine IV shifts with time modeling to simulate different market scenarios.
Everything you need to model options trades
Live Options Chain
Browse live options data for 4,000+ U.S. equities and ETFs. Filter by expiration and strike range.
Multi-Leg Positions
Build any strategy: spreads, poor man's covered calls, iron condors, or multi-strategy positions of any stock/option combination.
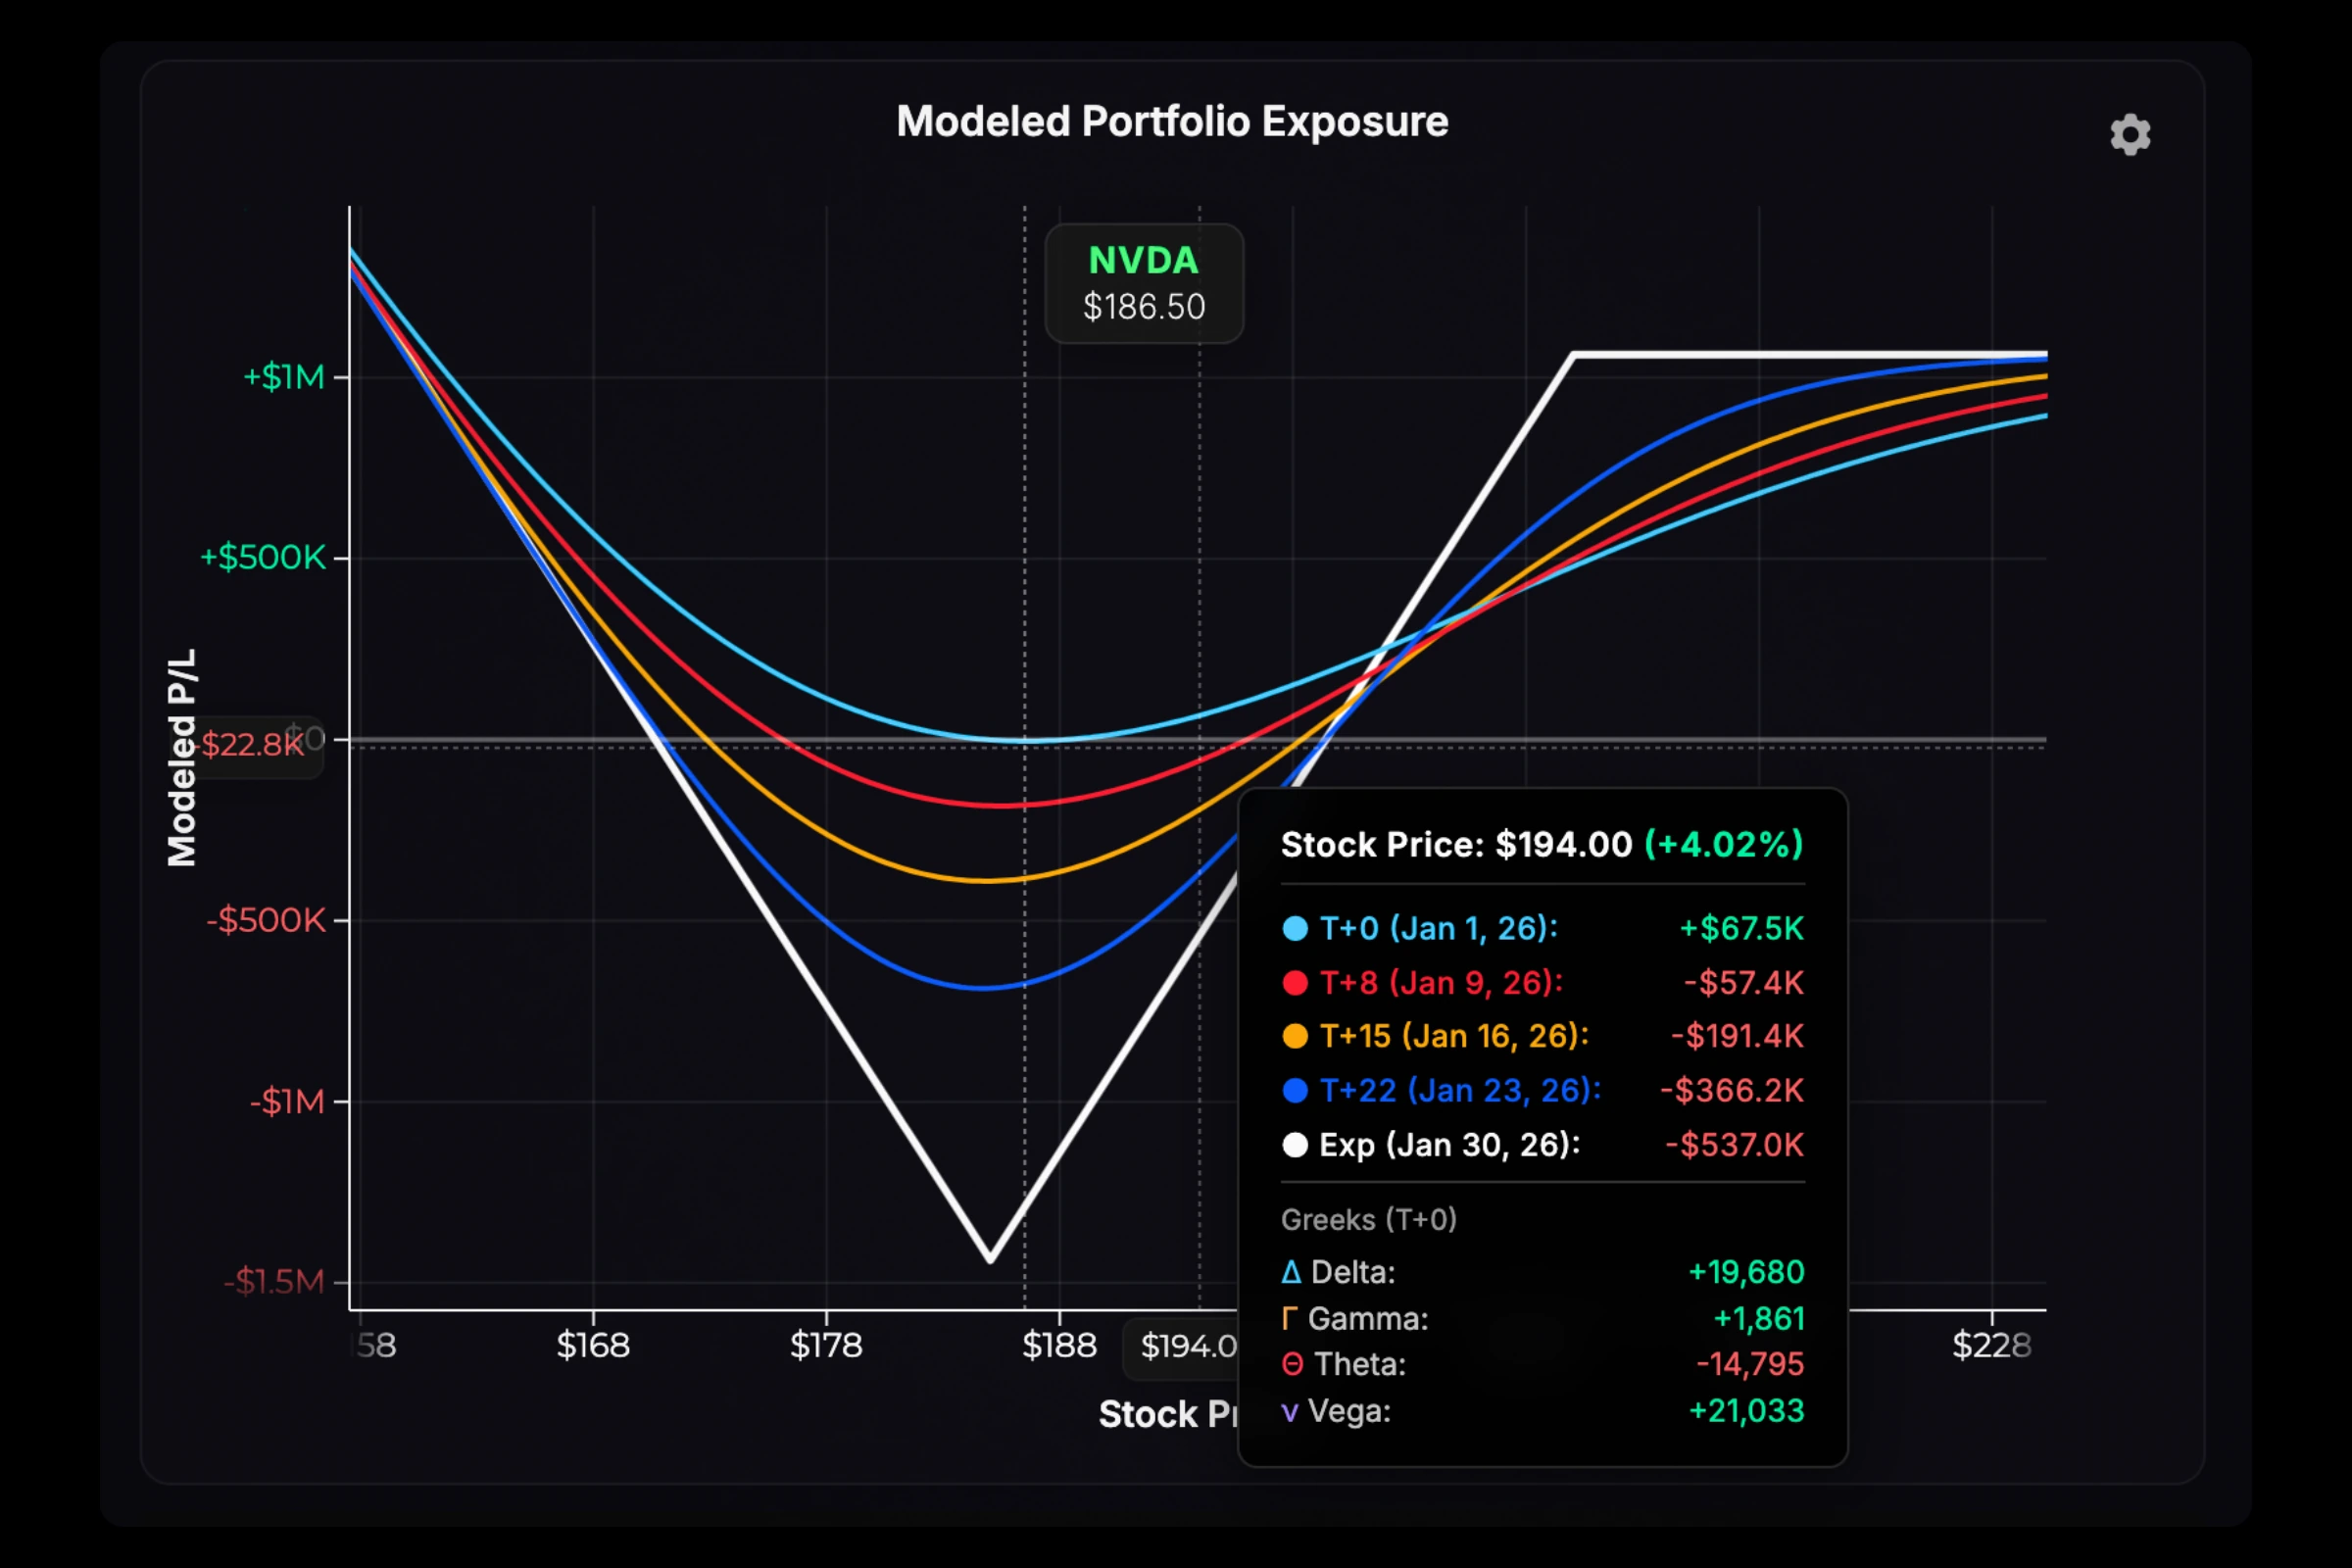
Live P/L Curves
See your position's modeled P/L across all stock prices and at any point in time. Updating live with the market.
T+ Time Modeling
Project your P/L curve forward to any future date before expiration.
IV Modeling
Simulate implied volatility increases or decreases with profit/loss differences from the baseline IV.
Adjustment Modeling
Add any adjustment and instantly compare current vs. adjusted P/L curves side by side.
Greeks Display
Delta, Gamma, Theta, and Vega for your full position at any price point.
Save & Load Portfolios
Save unlimited portfolios and load them instantly.
Market Coverage
Full coverage of U.S. equities and ETFs with live market data.
Pro
Model your options trades.
7-day free trial
- P/L curves for any options strategy
- T+ time lines to see time decay
- Implied volatility what‑if modeling
- Add adjustments and instantly compare current vs. adjusted P/L curves
- Save & load unlimited positions
- IV metrics for the current ticker
Frequently Asked Questions
30-Day Money-Back Guarantee
If you don't find the tool valuable, email [email protected] within 30 days of signup for a full refund. No questions asked.
What's included with Pro?
Full access to the Option Modeler with live market data for position analysis, P/L curves, trade adjustment modeling, and unlimited saved portfolios.
What payment methods do you accept?
We accept all major credit cards (Visa, Mastercard, American Express) through Stripe, our secure payment processor.
Is my payment information secure?
Yes. We never store your card details. All payments are processed securely through Stripe, which is PCI-DSS compliant.
How do I get help?
Email us at [email protected] — we typically respond within 24 hours.
Can I cancel anytime?
Yes, cancel anytime from your account settings. You'll keep Pro access until the end of your billing period.
Not ready to subscribe?
Try our free options calculators — no account needed.
Explore Free Calculators →