Options Trading Explained
A beginner's guide to understanding options contracts, basic terminology, option pricing, and how to start.
Options trading has a reputation for being complicated. There’s a lot going on, but once you get familiar with the foundational terms and study a few examples, it comes together quickly.
Why Trade Options?
- Limited risk — Know your max loss before entering the trade
- Leverage — Control 100 shares with much less capital
- Flexibility — Profit from up, down, or sideways movement
- Hedging — Protect stock positions from downside moves
Why Not Trade Options?
Options add complexity. You’re not just betting on direction—you’re betting on direction within a timeframe. A stock can eventually go up, but if it doesn’t move before your option expires, you lose.
There are more ways to be wrong: the stock moves the right direction but not far enough, or it moves too late, or volatility drops and crushes your option’s value. With stock, you just need to be right about direction eventually.
Without a specific, high-conviction outlook, options add unnecessary risk. They reward precision. If you don’t have a clear thesis on how much a stock will move, and by when, it’s safer to hold off on options until you do.
That said, understanding options mechanics is valuable—even if you’re not trading them yet.
What Is an Option?
An option is like paying for the right to buy something at today’s price, even if the price changes later.
Think of it like a deposit on a house. You pay a small fee to lock in the price for 30 days. If the house price jumps 20%, you still get it at the original price—your deposit was worth it. If the house burns down or you change your mind, you walk away and only lose the deposit.
Options work the same way:
- Premium = the deposit you pay upfront
- Strike price = the locked-in share price
- Expiration = your deadline to decide if you want to buy/sell the shares
You pay a small fee (the premium) for the right to buy or sell a stock at a set price. If things go your way, you profit. If they don’t, you lose what you paid—nothing more.
Defined risk is a huge benefit of buying options vs. stock. Buying stock comes with significant downside exposure. If the stock dips $10 and you own 100 shares, you lose $1,000. With an option, that same downside movement might only lead to a $500 loss.
The Two Types of Options
Call Options — Betting the Price Goes Up
A call option gives you the right to buy a stock at a specific price (the strike price).
Example: A stock is trading at $100. You buy a $100 strike call for $5.
The contract multiplier: Option prices are quoted per share, but each contract controls 100 shares. A $5.00 listed option price costs $500 ($5 × 100). A “$0.50 option” costs $50. Always multiply the option’s price by 100 to get its dollar value.
Scenarios for this call option with a strike price of $100:
- If the stock rises to $115, your call is worth at least $15 per share, or $1,500 total. You paid $500, so your profit is $1,000.
- If the stock stays at or below $100 through expiration, your call expires worthless. You lose the $500 you paid.
The chart below compares this call option to simply buying the stock. Hover to see the P/L at different prices:
Stock Entry: $100. Call Strike: $100. Call Price: $5.00 ($500 total)
The key tradeoff: the call limits your downside but amplifies your percentage returns.
If the stock drops to $80, the stockholder loses $2,000. The call buyer loses only $500—the premium paid.
If the stock rises to $115, the stockholder gains $1,500 (15% return). The call buyer gains $1,000 on a $500 investment (200% return).
That’s leverage. The downside? If the stock drops 10%, you lose 100% of your premium at expiration. The dollar risk is smaller, but the percentage swings are larger.
Put Options — Betting the Price Goes Down
A put option gives you the right to sell a stock at a specific price.
Example: A stock is at $100. You buy a put with a $100 strike for $3 ($300 total).
- If the stock drops to $90, your put is worth at least $10. You paid $3, so your profit is $7 per share, or $700 total.
- If the stock stays above $100 through expiration, you lose the $300 you paid.
Key Options Terms
Moneyness: ITM, ATM, and OTM
These terms describe where the stock price is relative to your strike:
In-the-Money (ITM) — The option has real value right now.
- A $100 call is ITM if the stock is at $110 (you can buy shares at $100, then sell at $110)
- A $100 put is ITM if the stock is at $90 (you can sell shares at $100, then buy at $90)
At-the-Money (ATM) — The strike price roughly equals the current stock price.
Out-of-the-Money (OTM) — The option has no immediate value.
- A $100 call is OTM if the stock is at $90
- A $100 put is OTM if the stock is at $110
But just because an option is OTM now doesn’t mean it will stay that way. A $100 call that’s OTM with the stock at $95 becomes ITM if the stock rallies to $105.
Intrinsic vs. Extrinsic Value
Every option’s price breaks down into two parts:
Intrinsic value — The real, immediate value. A call with a strike price of $100 when the stock is at $110 has $10 of intrinsic value—it can buy shares $10 below the current market price. OTM options have zero intrinsic value.
Extrinsic value — The “time value.” It’s what you’re paying for the possibility of the option becoming more profitable.
Example: A 100-strike call trading at $5 when the stock is $100:
- Intrinsic value: $0. Buying shares at $100 via the call has no advantage over buying at the $100 market price.
- Extrinsic value: $5 (the entire premium)
The option’s value comes entirely from the potential for the stock to rise before expiration.
But as expiration approaches, extrinsic value decays to zero.
The chart below shows the hypothetical call price as expiration approaches, assuming the stock price doesn’t move:
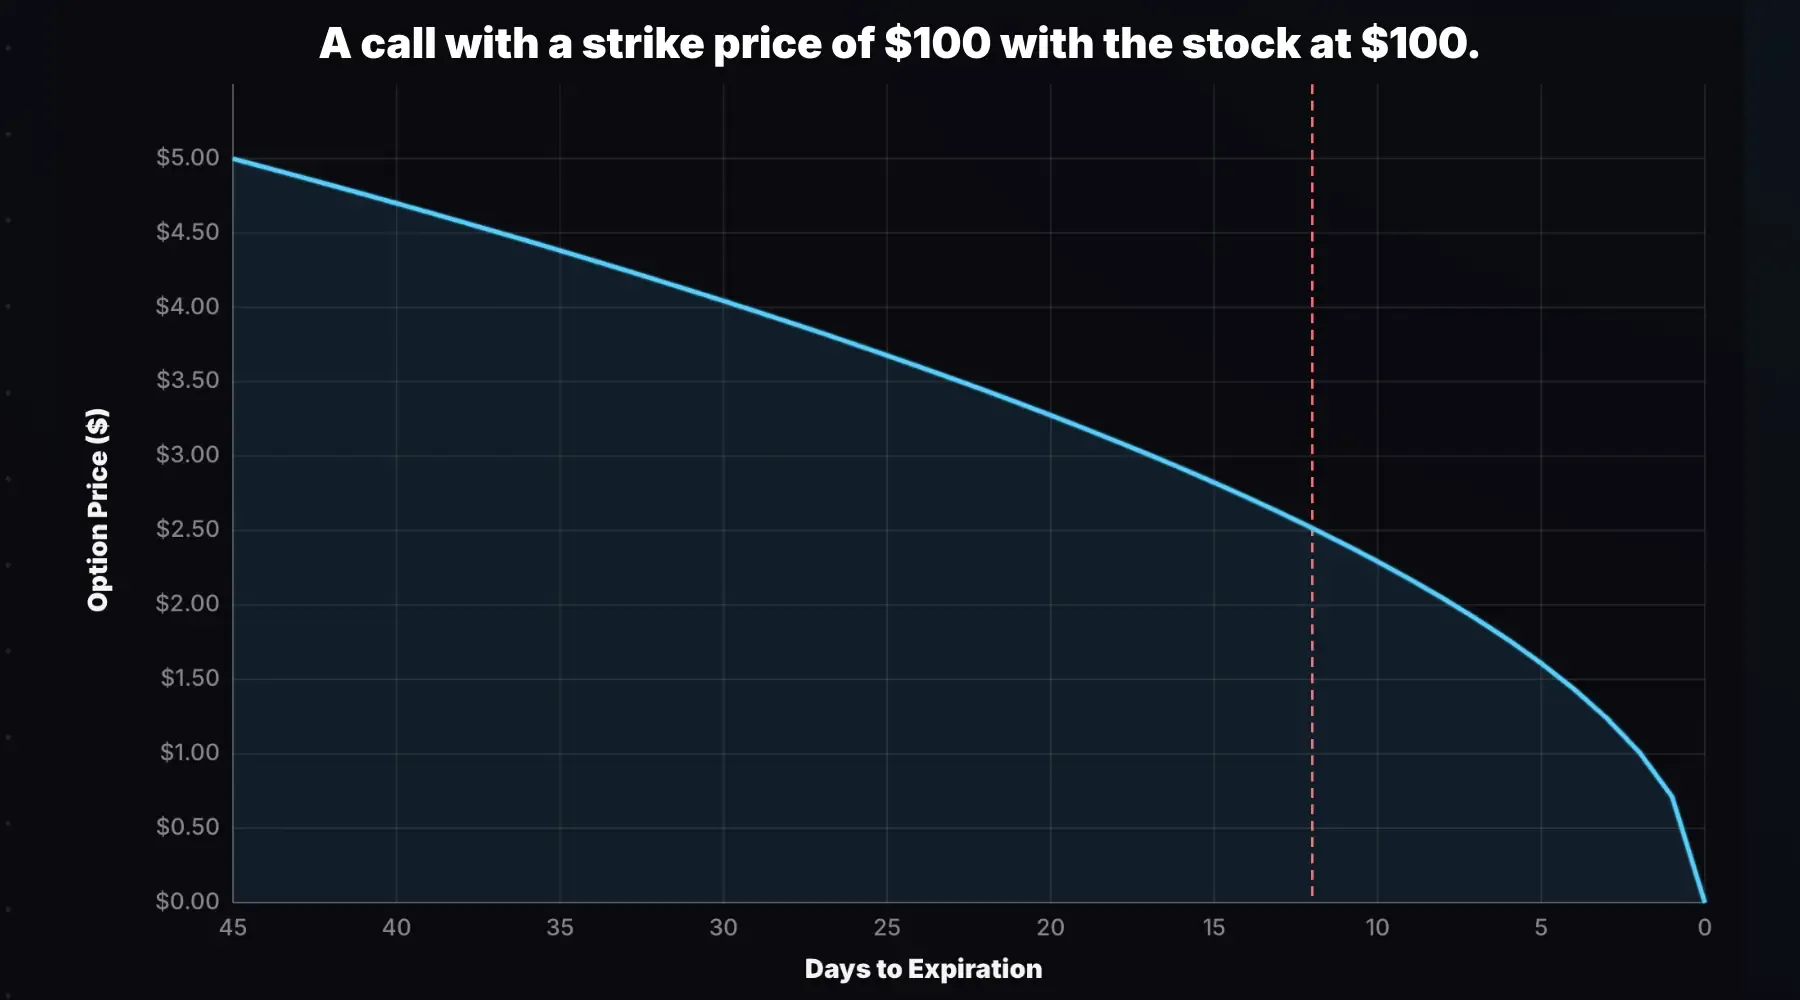
Note: The red dashed line shows where the option loses half its extrinsic value.
As the option gets closer to expiration without a stock price movement, it becomes less likely for the call to gain value because there’s less time for the stock to move.
What if the stock price is at $100 and the call’s strike price is $90? The call is in-the-money with $10 of intrinsic value since it can buy shares $10 below the current stock price. Notice how this option decays:
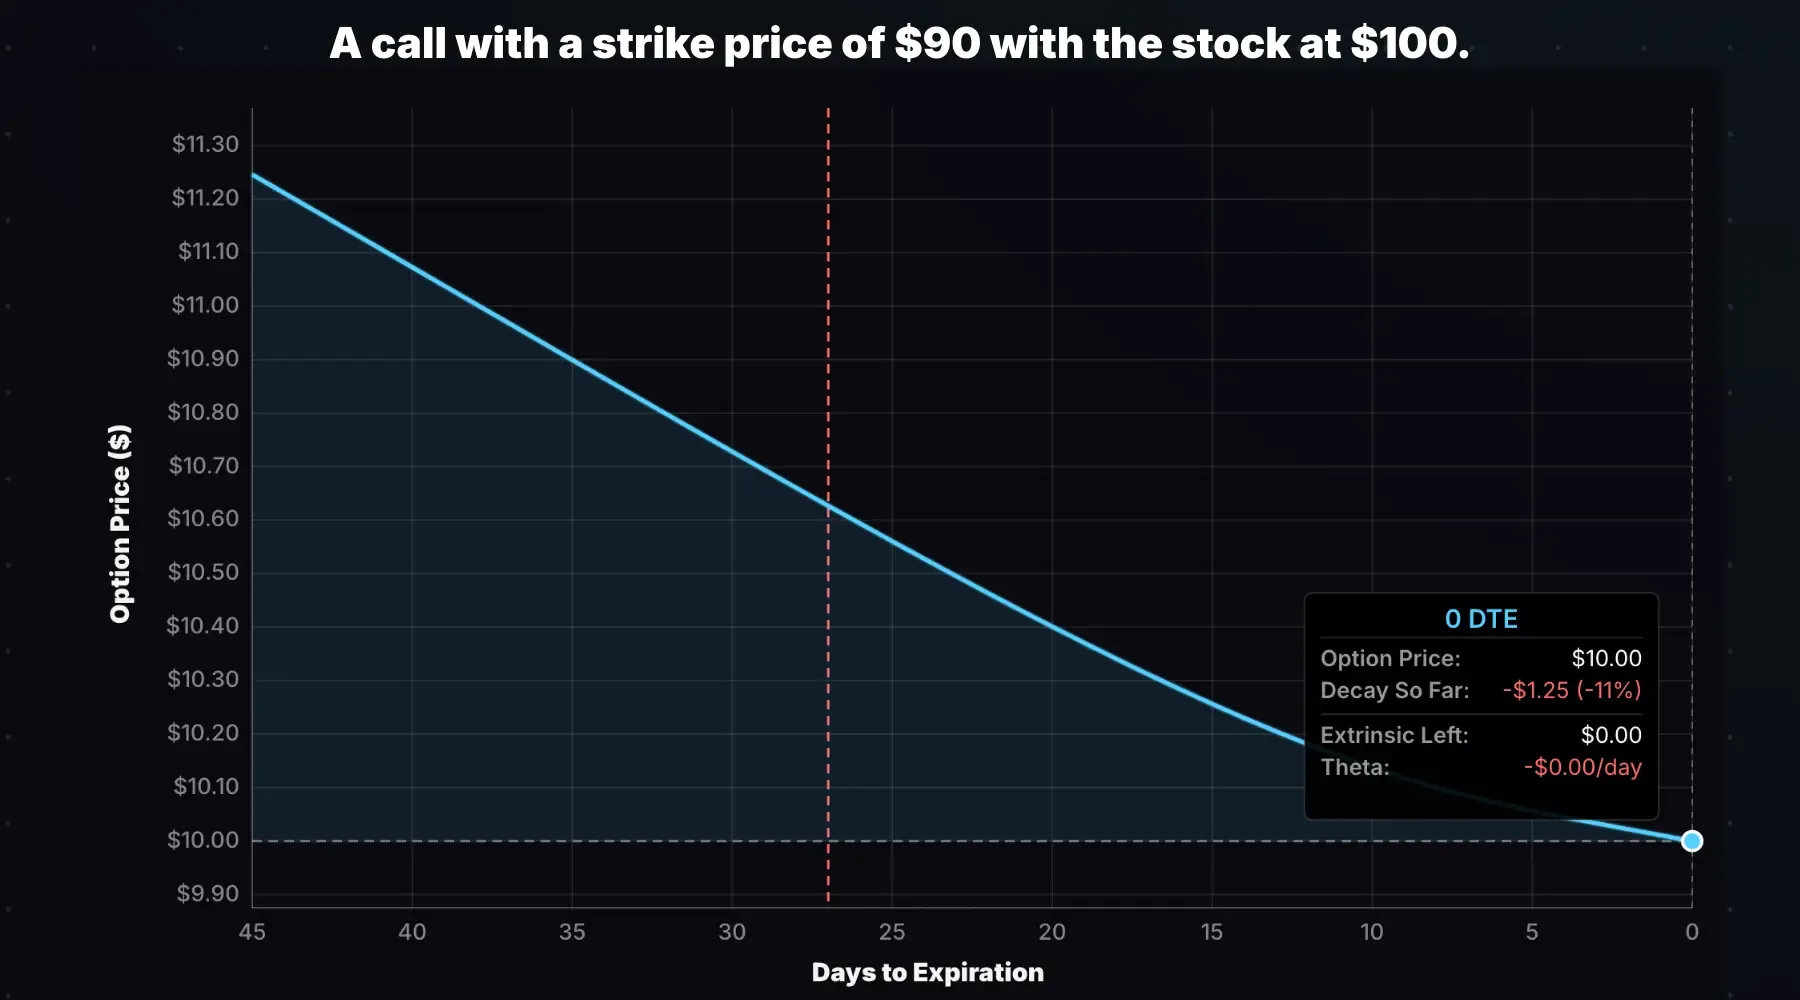
This call doesn’t lose all of its value by expiration. It only loses the extrinsic value ($1.25 in this case). At expiration (0 DTE), the call price is $10.00, not zero.
The call can buy shares at $90 when they’re worth $100—a built-in $10 gain. That value doesn’t decay.
Why Would Anyone Sell an Option?
For every option buyer, there’s a seller. If buying options is so great, why would anyone take the other side?
Option sellers collect the premium upfront. They profit if the option expires worthless—meaning the stock didn’t move enough. They’re betting on stability, not movement.
Revisit the option decay chart. Imagine selling the option at the higher price (left), then buying it back cheaper as it decays:
That’s what options sellers aim to do.
Think of it like being the insurance company instead of the person buying insurance. Most of the time, nothing happens and you keep the premium. But when something big happens, you’re obligated to make a big payout.
What Makes Options Expensive or Cheap?
Three things drive option prices:
- Where’s the stock relative to the strike? The further ITM, the more valuable the option. ITM options include the immediate gain from buying/selling shares at a better price than the market price.
- How much time is left? More time = more potential for the stock to move = more valuable option.
- How volatile is the stock? Stocks that move around a lot have pricier options.
In options trading, there’s something called implied volatility (IV)—the market’s expectation of how much a stock might move, as implied by the option prices on that stock.
A calm, steady stock? Traders don’t expect big swings, so options are cheap.
A volatile stock? Traders price in larger moves, so options cost more:
Same stock price, same strike price, same time to expiration—but the volatile stock’s options might cost 2–3x more. You’re paying for the possibility of a bigger move.
For a deeper dive, see What Is Implied Volatility?.
The Greeks
The Greeks measure how an option’s price changes relative to certain variables. They’re your position’s risk dashboard—each one shows your exposure to a different factor.
Now that you know what drives option prices (stock movement, time, volatility), the Greeks just quantify your exposure to each:
Delta — Exposure to stock movement. A 0.50 delta call gains ~$0.50 if the stock rises $1.
Gamma — How fast delta changes. More relevant once you’re comfortable with delta.
Theta — Exposure to time. Options lose value daily as expiration approaches. A theta of -0.05 means the option loses $0.05 per day, or $5 per contract.
Vega — Exposure to volatility. When IV rises, option prices rise. When IV falls, they fall. Vega tells you how much.
How Options Traders Make Money
Options traders make money by buying options and selling them at higher prices—or selling options and buying them back at lower prices. Traders rarely hold to expiration—you can close any time the market is open.
Directional traders buy calls or puts expecting a big move. If they’re right, the option’s value increases and they sell for a profit.
Premium sellers sell calls or puts expecting the stock to stay range-bound. If they’re right, the option loses value over time and they buy it back cheaper—or let it expire worthless.
It’s buy low, sell high—or sell high, buy low.
What Happens at Expiration
OTM options expire worthless. You lose the premium paid. No action required.
ITM options are auto-exercised if ITM by $0.01 or more:
- ITM calls: You buy 100 shares at the strike price
- ITM puts: You sell (or short) 100 shares at the strike price
Most traders close before expiration to avoid assignment and capture any remaining extrinsic value. If your option is profitable, you can simply sell it in the market instead of exercising.
How to Get Started
-
Take your time with education first. Don’t make real trades until you’re comfortable with the concepts.
-
Paper trade. Practice with fake money until you understand the mechanics.
-
Start with simple trades. Buy a single call or put, or trade a covered call if you have 100 shares of a stock. Don’t jump into spreads yet. Avoid selling naked options.
-
Trade popular stocks/ETFs. Stick to actively-traded option markets. Options on popular stocks and ETFs are much easier to enter and exit compared to inactively-traded markets.
-
Visualize before you trade. Try our Options Strategy Calculators to visualize the payoffs of various options strategies.
-
Start small. Risk only what you’re comfortable losing.
- Options give you the right to buy (calls) or sell (puts) at a set price before expiration
- You pay a premium upfront—that’s your max loss when buying options
- Each contract controls 100 shares, so multiply quoted prices by 100
- ITM options have intrinsic value; OTM options are pure extrinsic (time) value
- Option prices depend on stock price, time remaining, and implied volatility
- For every buyer there’s a seller—they profit when options expire worthless
- The Greeks measure your exposure to price (delta), time (theta), and volatility (vega)
Next: Call vs Put Options — Compare calls and puts side-by-side with interactive P/L charts.
Related Guides
- What Is Implied Volatility? — How IV affects option prices
- Long Call Calculator — Visualize call option P/L
- Long Put Calculator — Visualize put option P/L