Call vs Put Options: What's the Difference?
Understand call vs put options with interactive P/L charts. See exactly how calls profit when stocks rise, puts profit when stocks fall, and how time decay affects both.
If you’ve read our options trading basics guide, you know there are two types of options: calls and puts. This guide goes deeper—with interactive charts showing exactly how each one makes and loses money.
Calls profit when the stock rises. Puts profit when the stock falls.
Call Options Profit When the Stock Rises
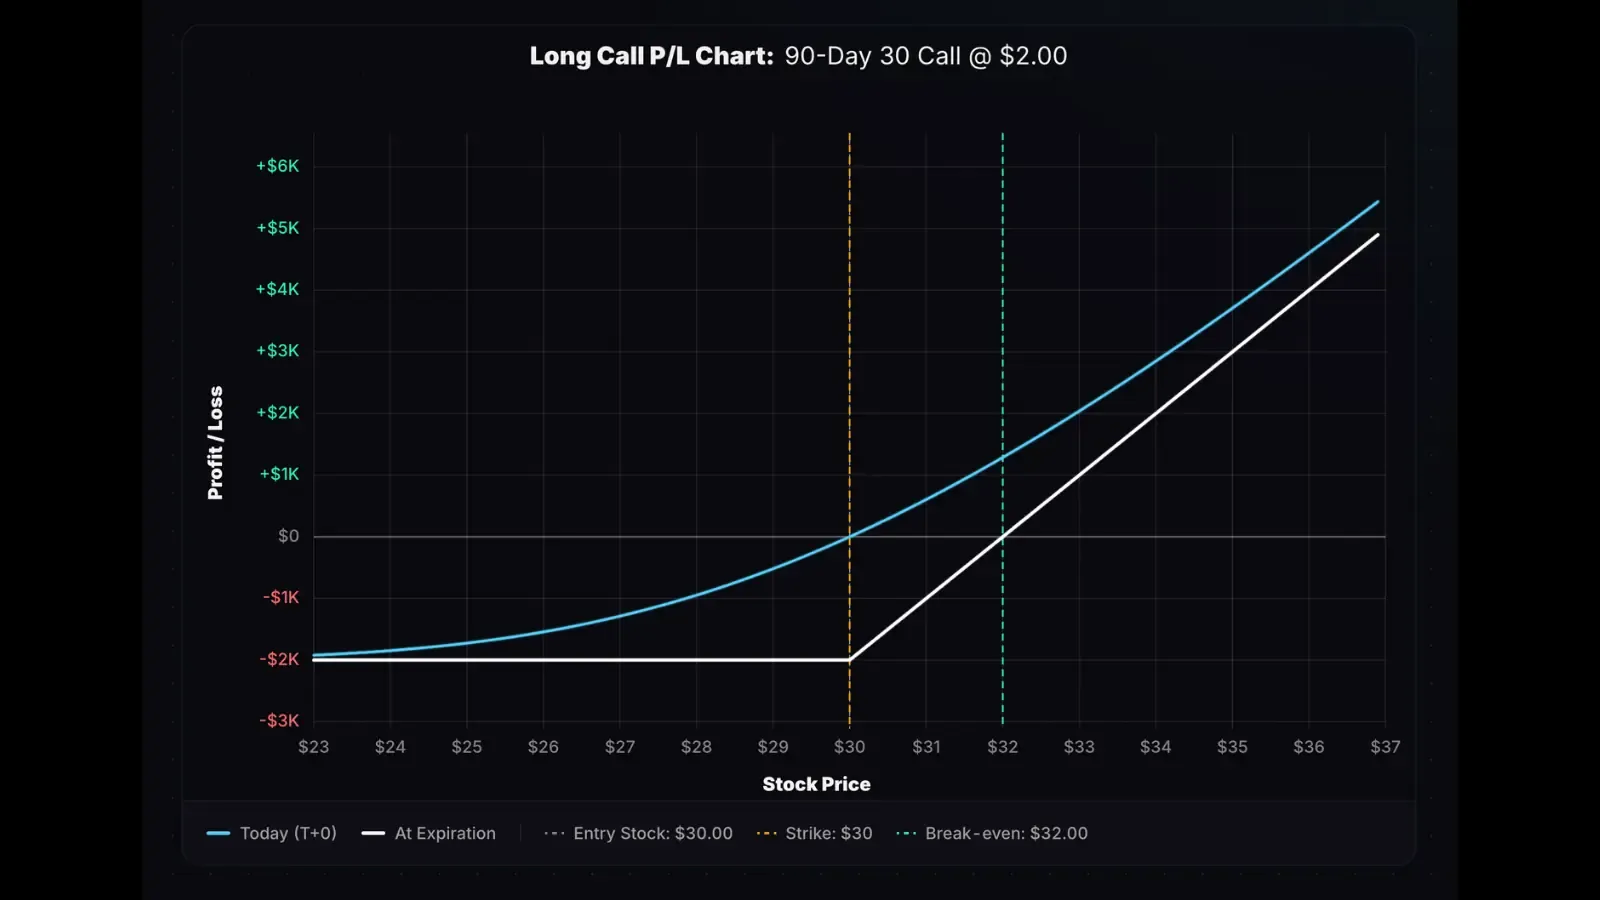
The chart below shows profit/loss for a call option with the stock initially at $100 (left dashed line). The strike price is $110—it gives the owner the right to buy 100 shares at $110. As the stock rises beyond that level, this right becomes increasingly valuable:
Entry cost: $5.00 ($500 total). Max loss: $500. Max profit: Unlimited.
The cyan line (top) shows P/L today. The white line (bottom) shows P/L at expiration.
Hover the entry stock price of $100. The call was purchased here. The Today P/L line shows $0.
Now hover to the right to simulate the call’s P/L as the stock price rises.
If the stock hits $120 at expiration, the call is worth $10—double the entry cost. That’s a 100% return on the option versus 20% on the stock. But if the stock is at or below $110 at expiration, the call expires worthless. You lose 100% of the premium, but losses are capped at that amount no matter how far the stock falls.
The gap between the Today and Expiration lines is time value. If the stock rises quickly, you profit more. If the move takes until expiration, you need a bigger move to profit. Buying options is a race against time.
Model any long call setup with our long call option calculator.
Put Options Profit When the Stock Falls
Put options work like calls but in reverse.
The chart below shows profit/loss for a put option purchased for $15 with the stock initially at $200 (right dashed line). The strike price is $190—it gives the owner the right to sell 100 shares at $190. As the stock falls below that level, this right becomes increasingly valuable:
Entry cost: $15.00 ($1,500 total). Max loss: $1,500. Max profit: $17,500 (if stock goes to $0).
Hover the entry stock price of $200. The put was purchased here. The Today P/L line shows $0.
Now hover to the left to simulate the put’s P/L as the stock price falls.
The put profits when the stock drops below the strike. And just like calls, sooner is better—the Today line (cyan) shows better profitability than the Expiration line (white) at every price.
Model any long put setup with our long put option calculator.
How to Read Option Payoff Diagrams
Both charts share the same shape: limited loss on one side, unlimited (or large) profit potential on the other. This asymmetry is what makes buying options attractive.
Here’s what’s happening in each scenario:
The call example: You own a 110-strike call on a $100 stock. If the stock rises to $120, your call lets you buy shares at $110 when the stock is $120. That $10 discount is real value that gets baked into the option’s price.
The put example: You own a 190-strike put on a $200 stock. If the stock falls to $170, your put lets you sell shares at $190 when the stock price is only $170. That $20 advantage—selling at $190 when shares are worth $170—gets embedded into the put’s price.
One important detail: Each option contract controls 100 shares. An option listed at $5.00 costs $500 total. When you see an option price listed at $15.00, that’s $15 per share—or $1,500 per contract. This is called the option contract multiplier. It’s confusing at first to associate two values with an option (the listed price and actual cost/value), but you will get used to it with more exposure.
| Call Option | Put Option | |
|---|---|---|
| Gives you the right to… | Buy 100 shares at strike | Sell 100 shares at strike |
| Gains value when… | Stock price rises | Stock price falls |
| Market outlook | Bullish | Bearish |
| Max loss (as buyer) | Premium paid | Premium paid |
When to Use Calls vs Puts
Buy a call when you expect a strong upward move before expiration.
Buy a put when you expect a significant drop before expiration.
The key phrase is “before expiration.” It’s not enough to be right about direction—you have to be right about direction and timing. If you don’t have a strong directional view over a specific time period, buying options probably isn’t the right trade.
| Your Outlook | Strategy |
|---|---|
| Bullish (expecting rise) | Buy call |
| Bearish (expecting fall) | Buy put |
| Neutral / No strong view | Don’t buy options—or consider selling strategies |
Why Trade Options Instead of Stock?
Options offer two advantages over stock: capped risk and magnified returns.
When you buy a call, your max loss is the premium paid—not the full stock price. But if the stock moves in your favor, your percentage returns can far exceed what you’d make owning shares.
Hover over the chart below to compare return potential for this hypothetical stock vs call option payoff:
Entry Stock Price: $100. Call Strike Price: $100. Call Entry Price: $5.00. Max Loss: $500.
When you buy a put, your max loss is also the premium paid—not unlimited like a short stock position. But if the stock price doesn’t move lower, your put purchase will lose money, while a short stock position might break even.
The main battle when buying options is time decay—you lose money as time passes without a favorable stock price movement.
Some strategies combine stocks and options, like the covered call and protective put.
How Time Decay (Theta) Affects Options
You’ve already seen time decay in action—the gap between the entry and expiration lines in the charts above. That gap shrinks every day, whether the stock moves or not.
Here’s how to understand time decay: an option’s price reflects the probability of becoming more valuable before expiration. Less time means less probability of a large, favorable stock price move, which means a lower option price (specifically, less time value in the option’s price).
Example: A $100 stock with a 100-strike call and 365 days to expiration (DTE):
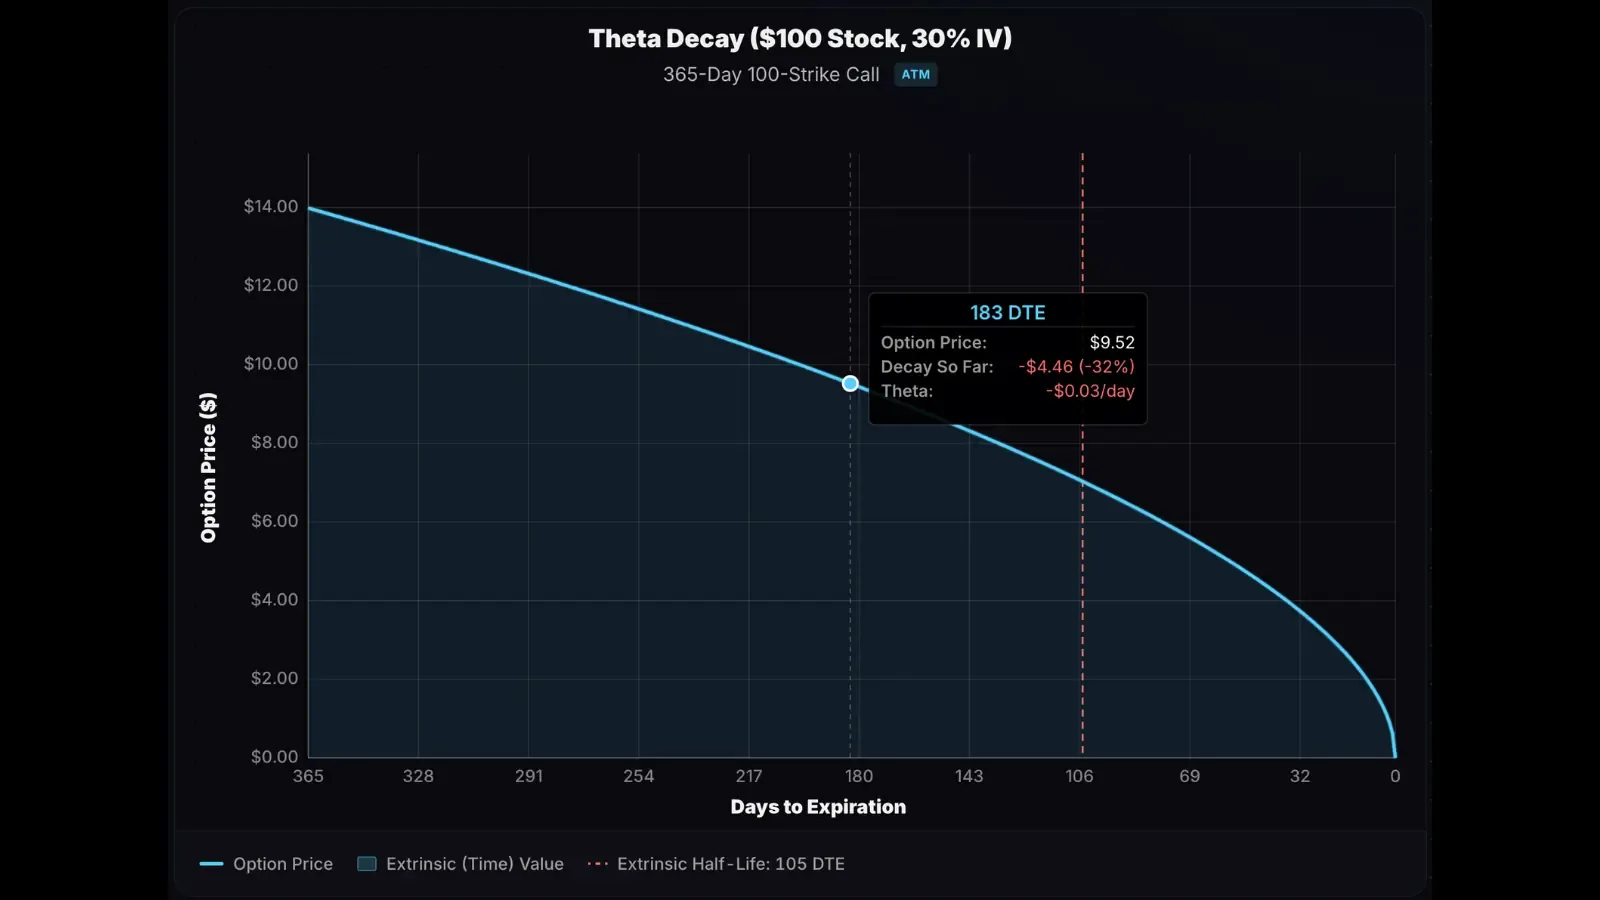
- 12 months to expiration: Plenty of time for the stock to appreciate. The call has significant value. $14 in this example.
- 6 months to expiration: Still a lot of time until expiration, but 6 months less than before. The probability of a large stock price increase has decreased. The call is worth $9.52 now.
Calculate your own option decay curves with our theta decay curve calculator.
Buying vs Selling Options: Which Is Riskier?
So far we’ve focused on buying options. But there’s another side to every trade: selling/shorting options.
If you sell an option to open: You collect premium upfront and bet the option’s price will fall. You profit if it expires worthless or you buy it back cheaper.
The catch: sellers take on significant risk. Losses can be substantial if the stock moves against you—and for naked call sellers, the risk is theoretically unlimited.
Option buyers have time against them, but positively asymmetric return potential (profits can far exceed losses).
Option sellers have time on their side, but negatively asymmetric return potential (losses can far exceed profits).
For beginners: stick to buying calls and puts, or strategies like covered calls and cash-secured puts that bridge the gap from stock investing, but with less risk than buying 100 shares.
Call vs Put FAQ
Can I lose more than I invested?
Not when buying options. Your maximum loss is the premium paid.
What happens if I don’t sell before expiration?
Out of the money: Expires worthless. You lose the premium.
In the money: Automatically exercised. A call becomes +100 shares; a put becomes -100 shares (a short position). Close before expiration if you don’t want the stock position.
The Bottom Line
Calls profit when stocks rise. Puts profit when stocks fall. Both require you to be right about direction and timing.
Next: What Is Implied Volatility? — How IV affects option prices, and why it matters
Visualize your trades: