
Long Gamma vs Short Gamma Explained
Learn what long and short gamma mean in options trading, how gamma affects your position delta, and why it matters for managing directional risk.
Gamma measures how much an option’s delta changes when the underlying moves $1. Since delta measures your directional exposure (how much you make or lose per $1 move), gamma tells you how that exposure accelerates or decelerates—and whether big moves help or hurt your position.
High gamma = Your delta shifts dramatically with small stock moves.
Low gamma = Your delta stays relatively stable. A stock position has zero gamma—if you own 100 shares, you always make or lose $100 per $1 move. Options are different.
Look at the NVDA long call butterfly below with 16 days to expiration. As of today (T+0), the delta is 0 near the current stock price, and gamma is low.
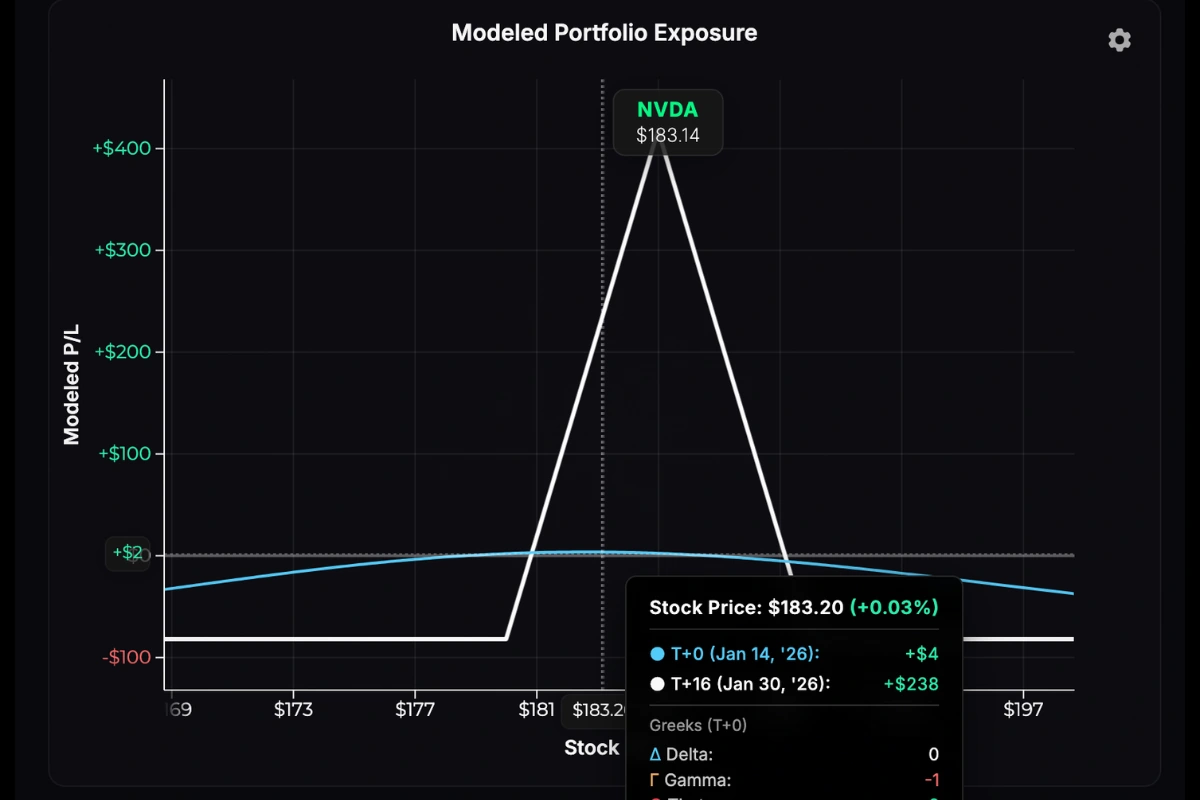
An NVDA long call butterfly. Notice how the T+0 line (cyan) is relatively flat across a wide price range. This flatness means P/L changes stay stable as the stock moves—low gamma visualized.
Now let’s look at the projected P/L curve + delta and gamma for this same position two weeks in the future (T+14):
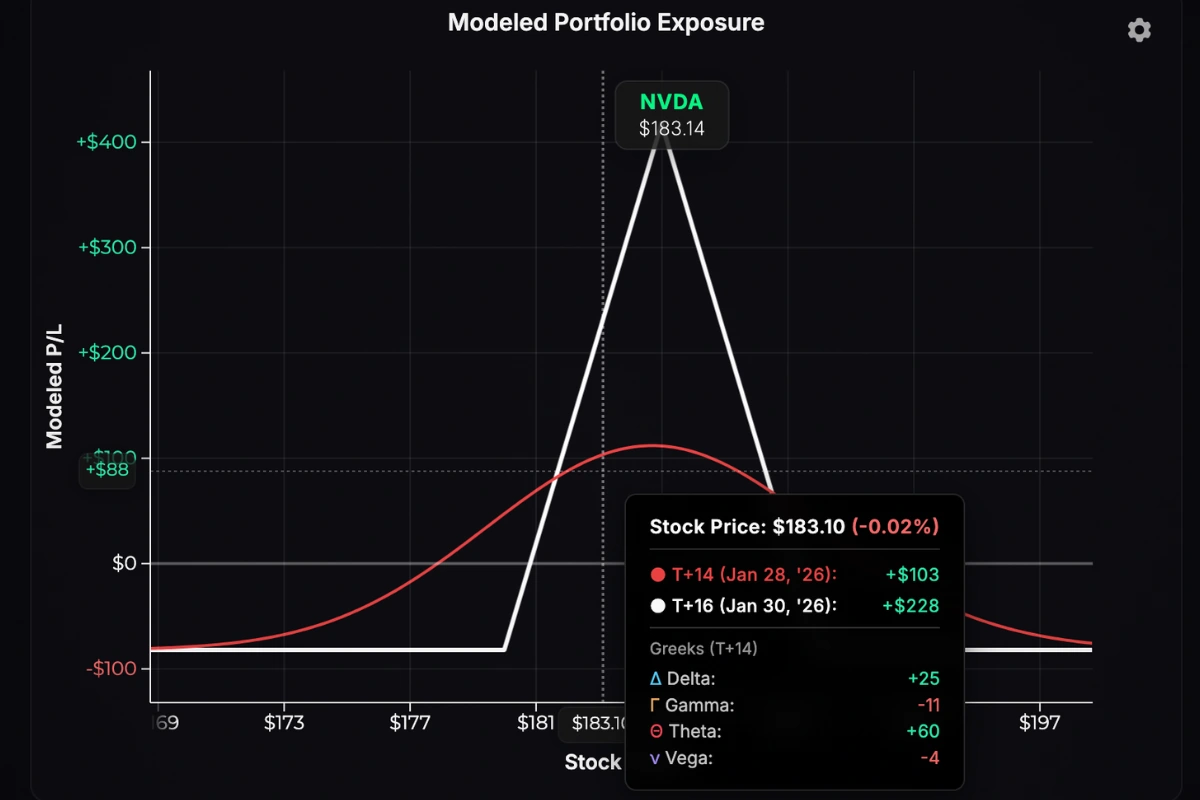
Notice how the P/L line is more curved. As the stock price moves, the P/L changes more rapidly (higher gamma). Note the higher gamma value in this chart vs. the previous one.
Why ATM Options Have the Highest Gamma
Gamma peaks at the money and drops off as you move further in or out:
- Far OTM options have low gamma because delta is already near zero and barely budges.
- Deep ITM options also have low gamma since delta is already close to 1.0.
- ATM options have the highest gamma (especially near expiration) because they’re balanced on a knife’s edge—a small move can flip them from worthless to valuable.
Here’s an intuitive way to think about it: if you’re long a 100-strike call on a stock trading at $100 the day of expiration, your odds of finishing ITM are roughly 50/50. Every dollar matters. If the stock goes to $101, the odds surge. If it falls to $99, they plummet. That’s high gamma—delta is unstable because the outcome is uncertain.
Far OTM options don’t have this sensitivity. The outcome is already decided.
Long Gamma (Positive Gamma)
A long gamma position benefits from movement. This includes long calls, long puts, straddles, strangles, and debit spreads.
With positive gamma, your delta moves with the stock:
- Stock rises → Delta increases
- Stock falls → Delta decreases
Your exposure grows when you’re right and shrinks when you’re wrong.
Long Gamma Example
Hover over the chart to see a 60-day long call’s modeled delta and gamma values at various stock prices:
Long 150 Call. 60 DTE. 30% IV. Hover to see delta and gamma at each price point. The cyan line shows the option’s theoretical value at entry (T+0), while the white line shows the intrinsic/option value at expiration.
Short Gamma (Negative Gamma)
A short gamma position profits from stillness. This includes short calls, short puts, short straddles, and short strangles.
With negative gamma, your delta moves against the stock:
- Stock rises → Delta decreases (more negative)
- Stock falls → Delta increases (more positive)
Your exposure grows when you’re wrong. If the stock keeps moving against you, losses accelerate.
Short Gamma Example
Hover over the chart to see a 60-day short call’s modeled delta and gamma values at various stock prices:
Short 150 Call. 60 DTE. 30% IV. Hover to see delta and gamma at each price point.
At the left of the chart, the delta of this short call is -0.05 and gamma is -0.006. If you were short this call, you’d lose $5 if the stock went from $120 to $121.
Hover over $150 and you’ll see delta is -0.55 and gamma is -0.02. You’d lose $55 if the stock went from $150 to $151.
The increasing loss exposure as the stock rips higher is how to interpret negative gamma on a short option position.
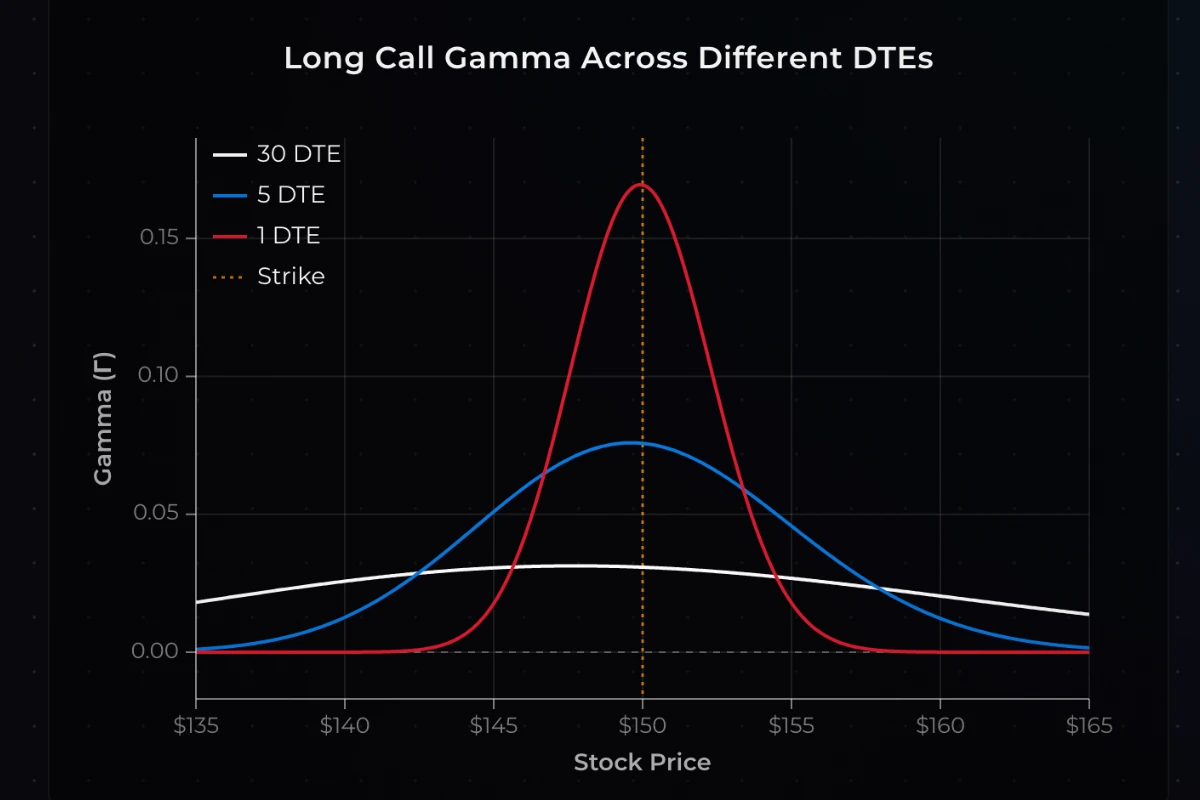
Gamma and Time to Expiration
Gamma doesn’t affect all options equally as expiration approaches. What happens depends on moneyness.
For ATM options, gamma grows exponentially as expiration nears. With less time remaining, small price changes have an outsized impact on whether the option finishes ITM or OTM. Delta becomes unstable—it can swing from 0.30 to 0.70 on a modest move. This is why 0DTE ATM options are so volatile.
For OTM and ITM options, gamma shrinks toward zero. The outcome is already decided, so delta barely moves.
The interactive chart below shows how gamma changes across different days to expiration (DTE) for a long 150-strike call:
Long 150 Call. 30% IV. Comparing 30, 5, and 1 DTE. Notice how gamma peaks at the strike price ($150) and explodes as expiration approaches. At 30 DTE, gamma is relatively flat. At 1 DTE, the spike is dramatic—while OTM/ITM gamma falls toward zero.
This is why short gamma positions near expiration are dangerous. Your exposure can explode on a small adverse move right when there’s no time to recover.
What Is Gamma Risk?
Gamma risk is the danger of rapid delta shifts. It’s highest for:
- ATM options
- Options near expiration
- Short positions
On a high-gamma short call near expiration, you might lose $10 if the stock rises $1, then lose $50 on the next $1 increase. That rapidly increasing P/L sensitivity is gamma risk.
Key Takeaways
- Gamma measures how much delta changes per $1 stock move.
- Long gamma = exposure grows when you’re right, shrinks when you’re wrong.
- Short gamma = exposure grows when you’re wrong, shrinks when you’re right.
- ATM options have the highest gamma, especially near expiration.
- OTM/ITM options have gamma falling toward zero near expiration.