Quick Start Guide
Get started with projectoption.
Quick Start
1. Search for a Stock
Use the search bar to find any optionable stock by ticker (AAPL, SPY, TSLA, etc.).

The Buy/Sell buttons will model purchasing or shorting shares of stock.
To the right, IV metrics are displayed.
IV30 is the 30-day at-the-money implied volatility for the stock.
If available, IV Rank and Percentile will be displayed. IV Rank/Percentile are not available for all tickers. Only the most liquid and popular stocks/ETFs will have IV Rank/Percentile displayed.
2. Browse the Options Chain
The options chain appears on the left side:
Select an expiration from the dropdown.
- Calls on the left
- Strike prices in the center
- Puts on the right
- Custom column showing Delta, Volume, or Open Interest
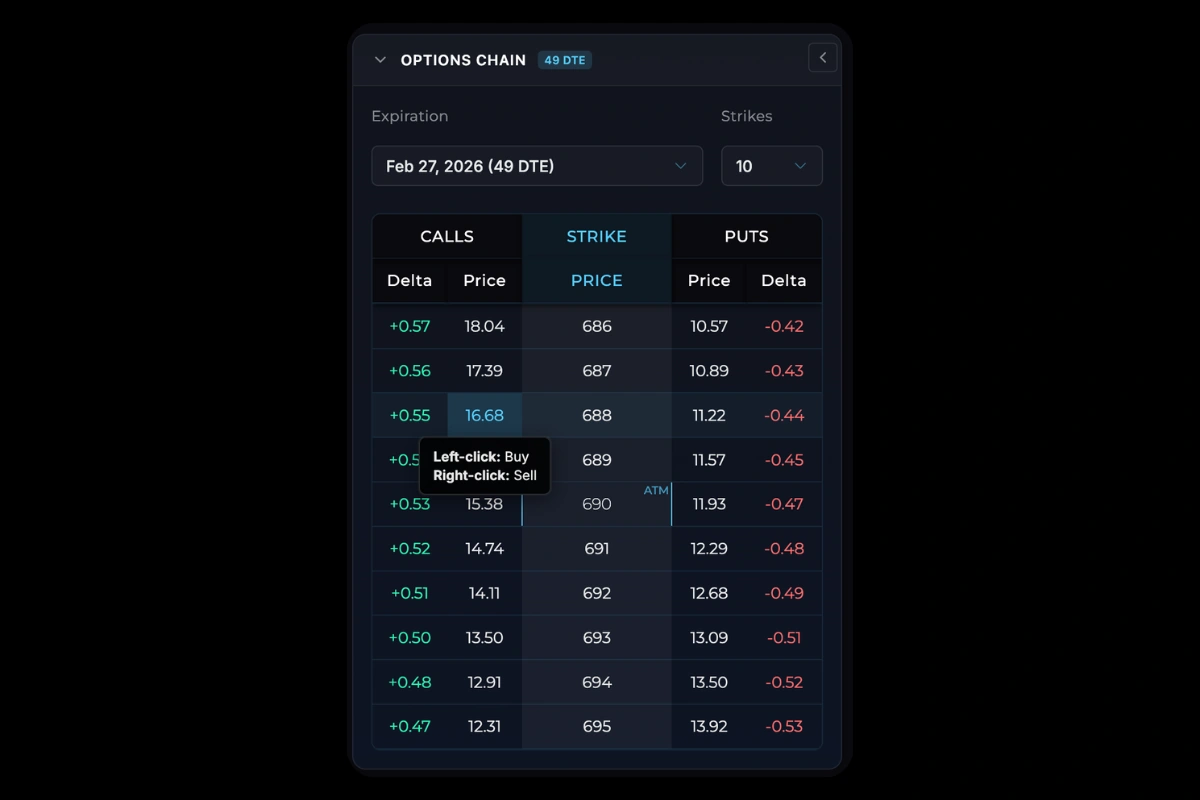
3. Add Positions
| Action | How |
|---|---|
| Buy option | Left-click on price |
| Sell option | Right-click on price |
| Buy/Sell stock | Buy/Sell buttons in the top row by the stock price display |
4. Manage Positions
In the portfolio table (bottom right), you can edit the quantity or entry price of positions directly.
Right-click any row for more options:
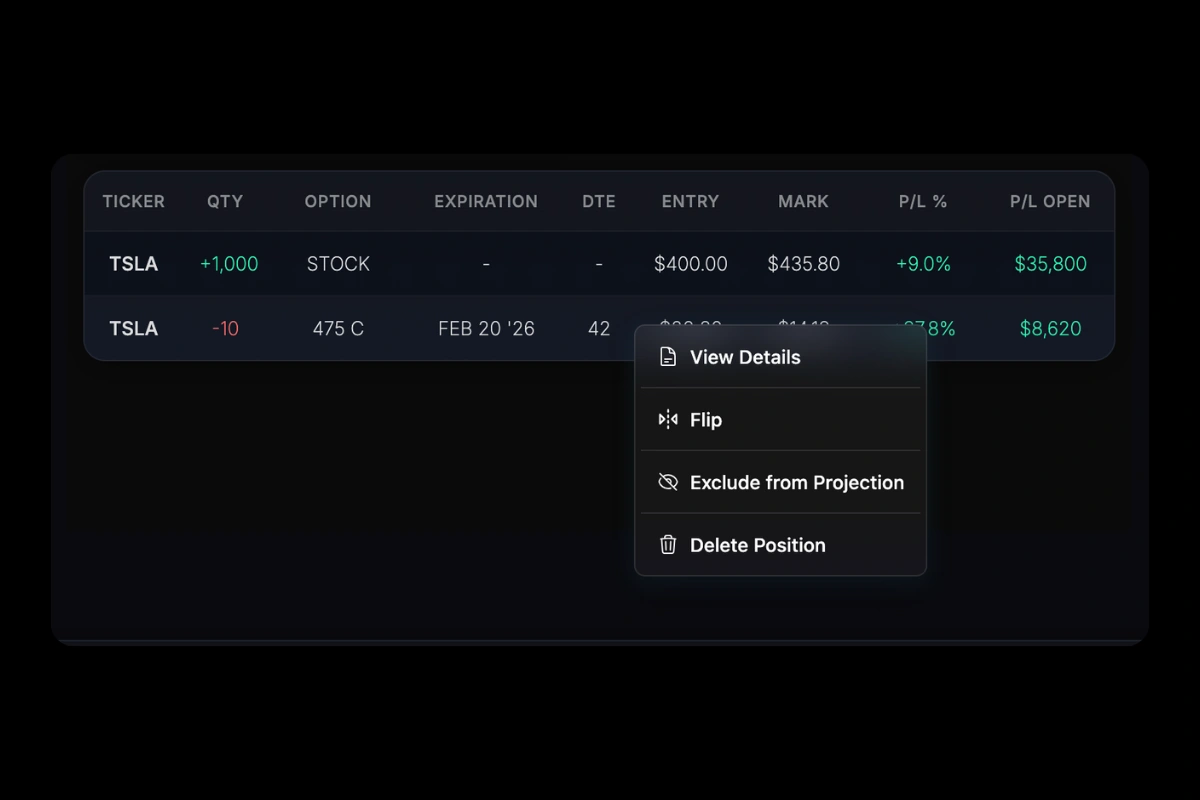
- View Details: Full option details
- Price History: View the price history of a stock or option. Click multiple positions in the table and enter Price History to see the combined position price history.
- Flip: Reverse quantity (long ↔ short)
- Exclude from Projections: Exclude position from P/L chart and Portfolio Info table (P/L Open, Greeks)
- Delete: Remove position
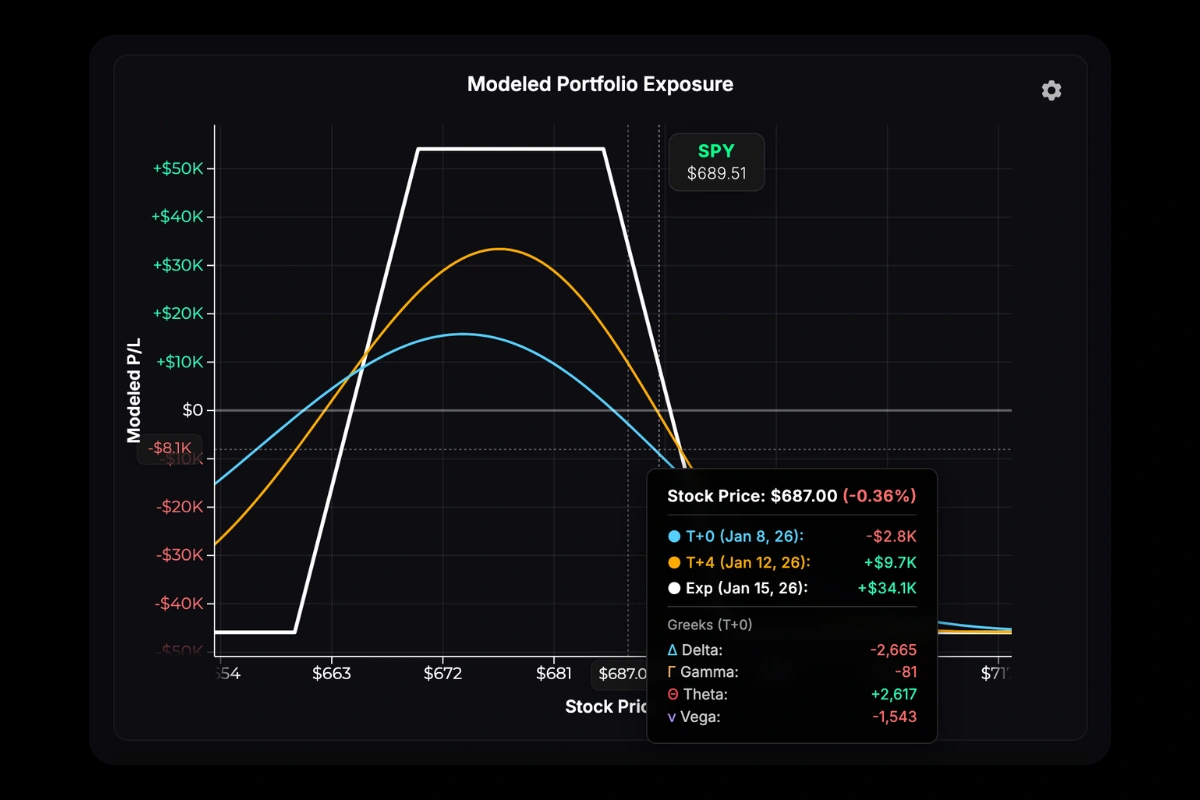
5. Read the P/L Chart
The chart shows your theoretical P/L across stock prices. See P/L Curves for details on interpreting the T+0, T+50%, and Expiration lines.
6. Modeling Tools
Below the options chain, three tabs let you model scenarios:
Time Modeling: Add custom T+ lines to project P/L at specific future dates.
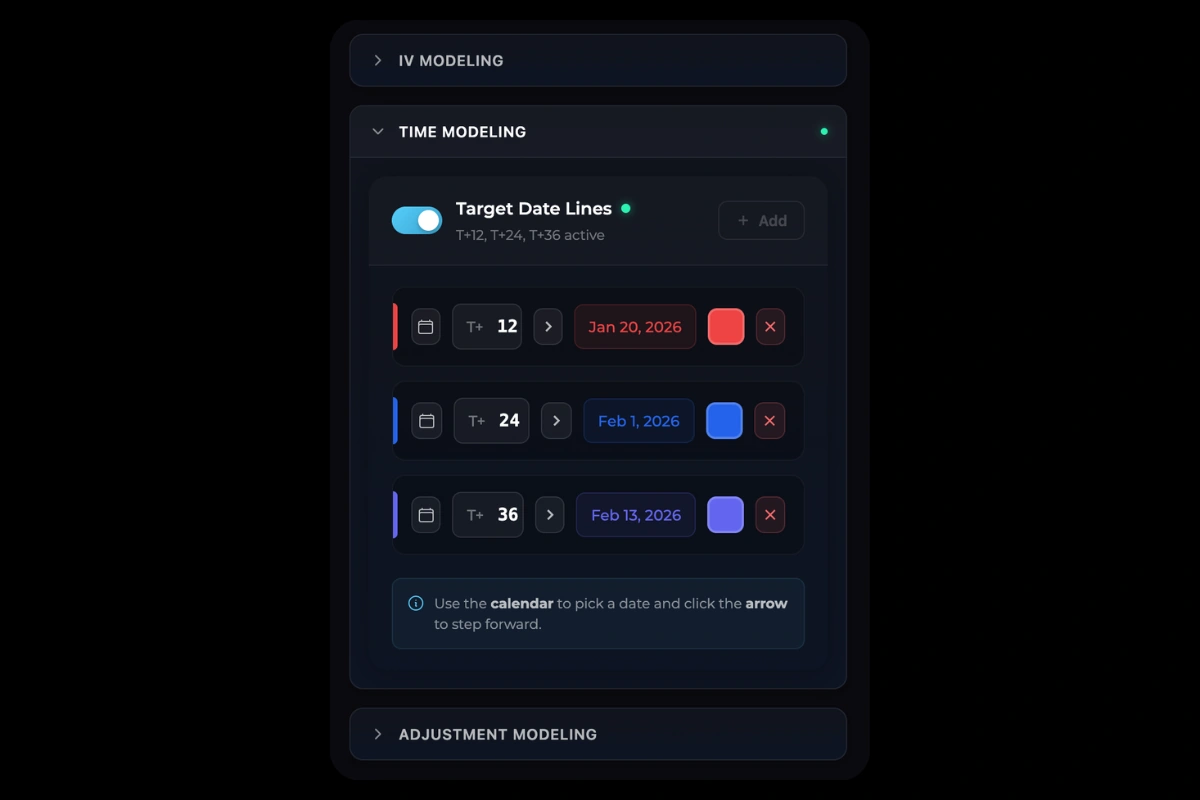
IV Modeling: Shift implied volatility up or down to visualize vega exposure.
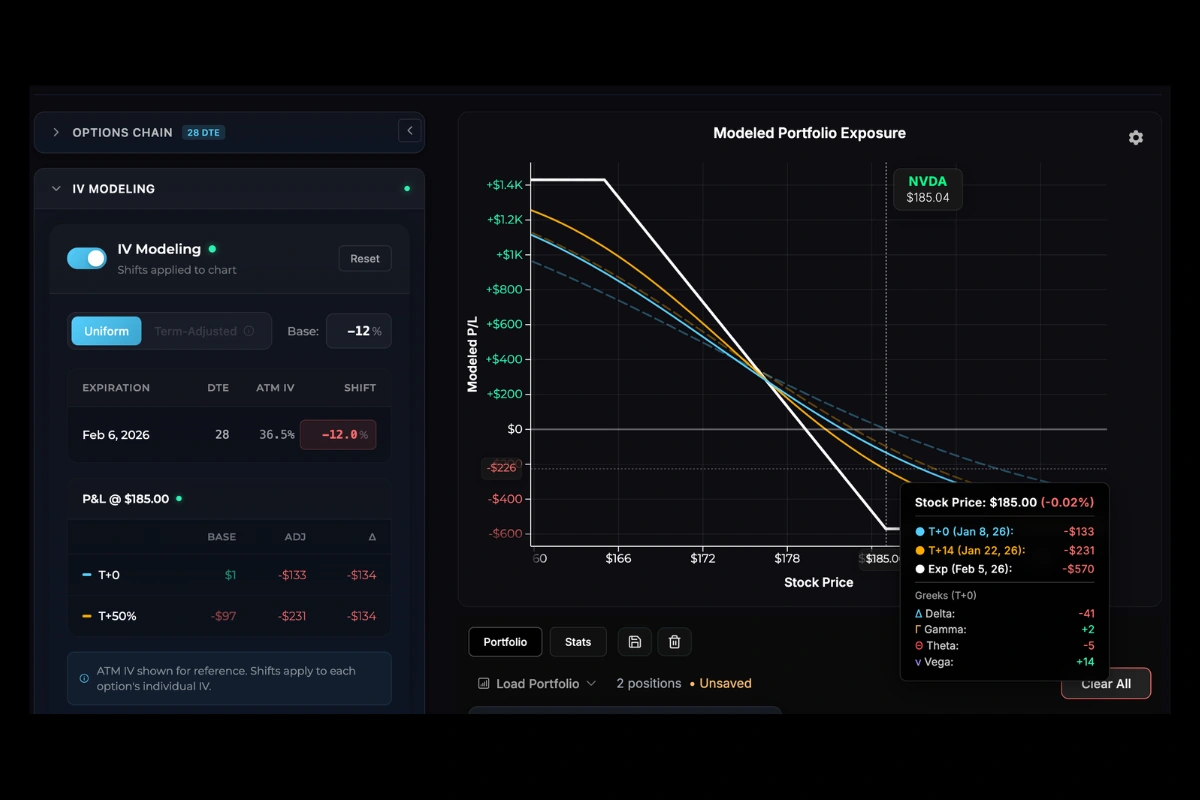
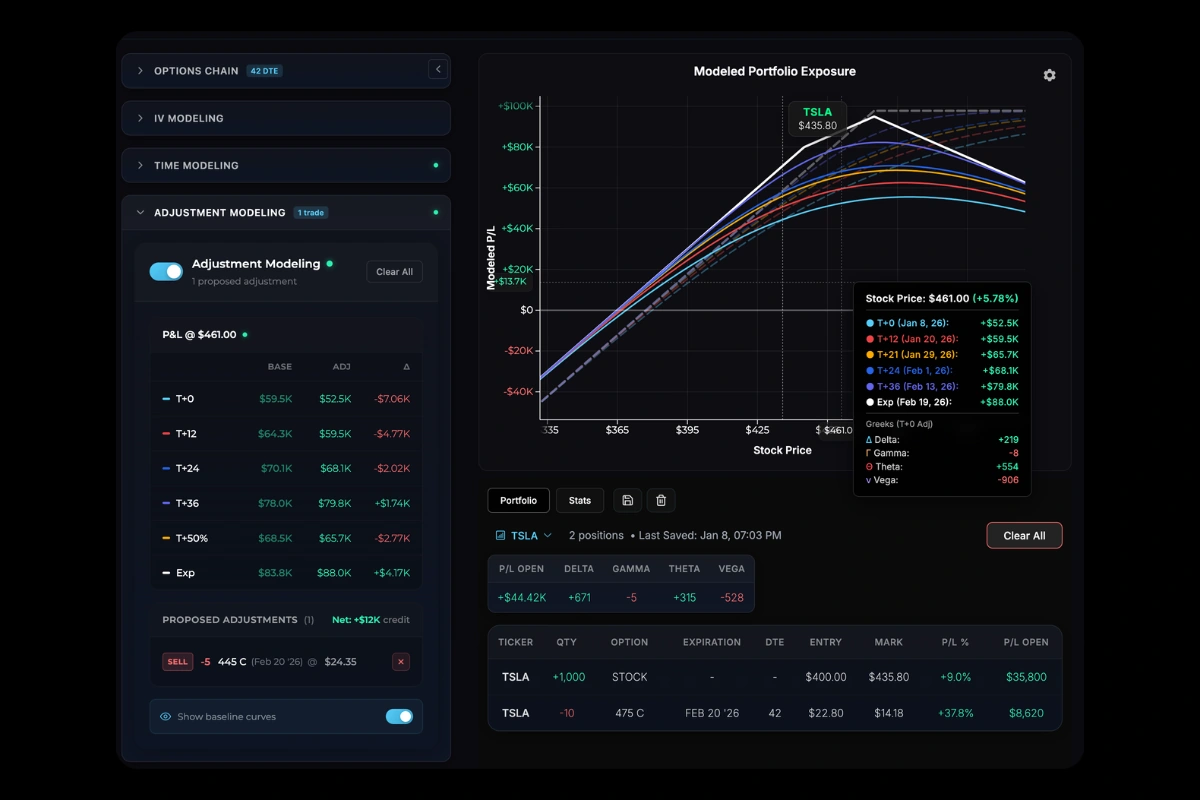
Adjustment Modeling: Compare your current position against proposed trades. Add new positions from the chain; they appear as proposed adjustments with a separate curve overlay. Hover the chart to see P/L differences at various prices and time points.
Next Steps
- P/L Curves: Chart interpretation
- T+ Lines: Custom time projections
Was this page helpful?