Why Theta Decay Isn't Linear
Option theta decay accelerates for ATM but flattens for OTM. Learn why time decay isn't linear with the expected move framework—and visualize it yourself.
I’ve been building tools for the new projectoption, and the latest one I thought would be cool is a theta decay curve calculator.
It’s simple: you plug in an option’s details, and it plots the theoretical price each day from now through expiration, assuming the stock price stays flat. Basically, pure time decay visualized.
But when you play with the inputs, you notice things—which is what this post is about.
What Is Theta Decay?
Theta is one of the option greeks—it measures how much an option’s price is expected to drop from one day passing.
An option priced at $1.00 with a theta of -0.05 is expected to fall to $0.95 the next day, all else equal.
But here’s the nuance: theta only erodes extrinsic value. Intrinsic value doesn’t decay.
Quick example: A $5.00 option with $2.00 of intrinsic value has $3.00 of extrinsic. Theta tells you how fast that $3.00 disappears—not the full $5.00.
This matters because ITM options have intrinsic value shielding them, while OTM options are pure extrinsic.
The Expected Move Cone
Most explanations stop at “ATM decay accelerates into expiration.” Just memorize it.
But I like to understand why. Why does the ATM curve accelerate near expiration? Why do OTM and ITM curves flatten?
The answer is the expected move cone.
Implied volatility defines a probability range around the current stock price—how far the market thinks the stock could move (as implied by the options). As expiration approaches, that range narrows. Less time means less potential movement:
At 30 days to expiration (DTE) with 30% IV, a $100 stock has roughly ±$8.60 of expected move. At expiration, the cone collapses to zero.
A quick note: this cone represents the one standard deviation move—about a 68% probability range. It’s not a hard boundary. Options outside the cone still have value because they price in the possibility of larger moves. But as a mental model for why decay curves behave differently, it’s useful. The further a strike drifts outside the cone, the faster that probability (and extrinsic value) bleeds away.
Your strike’s position relative to this shrinking cone determines your decay profile.
ATM vs OTM vs ITM Decay Curves
Think of the distance between a strike and the edge of the cone as a proxy for extrinsic value. When a strike is near the center of the cone, it has meaningful extrinsic. Once the cone shrinks past it, there’s little left to decay.
-
ATM strikes sit at the center. They stay inside the cone until the final moment—holding extrinsic value, then collapsing rapidly. Trace the top edge of the cone from left to right: that curve is the ATM decay profile.
-
OTM strikes start near the edge. Follow the cone’s edge until it crosses the 105 call strike line—that’s when the option decay slows. Front-loaded decay, then decelerating to flat.
-
ITM strikes have intrinsic value that doesn’t erode—only the extrinsic portion decays. Here’s the key insight: an ITM call and its corresponding OTM put (same strike) have similar levels of extrinsic value, and their decay curves look similar. A 90-strike call on a $100 stock decays like the 90-strike put—it just carries $10 of intrinsic value along for the ride.
That’s it. The cone shrinks, and where your strike sits determines when the market stops pricing in probability that it matters.
Try different strikes in the theta decay calculator to see these profiles yourself.
How Implied Volatility Affects Theta Decay
The expected move cone isn’t fixed—IV determines its width. The same strike can have completely different decay profiles depending on volatility.
Higher IV widens the cone, keeping more strikes “in play” longer. OTM options get steeper, more ATM-like decay curves:
With 100% IV, that same $100 stock has ±$28.67 of expected move. The 95 and 105 strikes we looked at earlier now stay inside the cone much longer going into expiration—giving them ATM-like decay profiles.
Here’s a specific example. A 120-strike call on a $100 stock with 30% IV and 60 DTE:
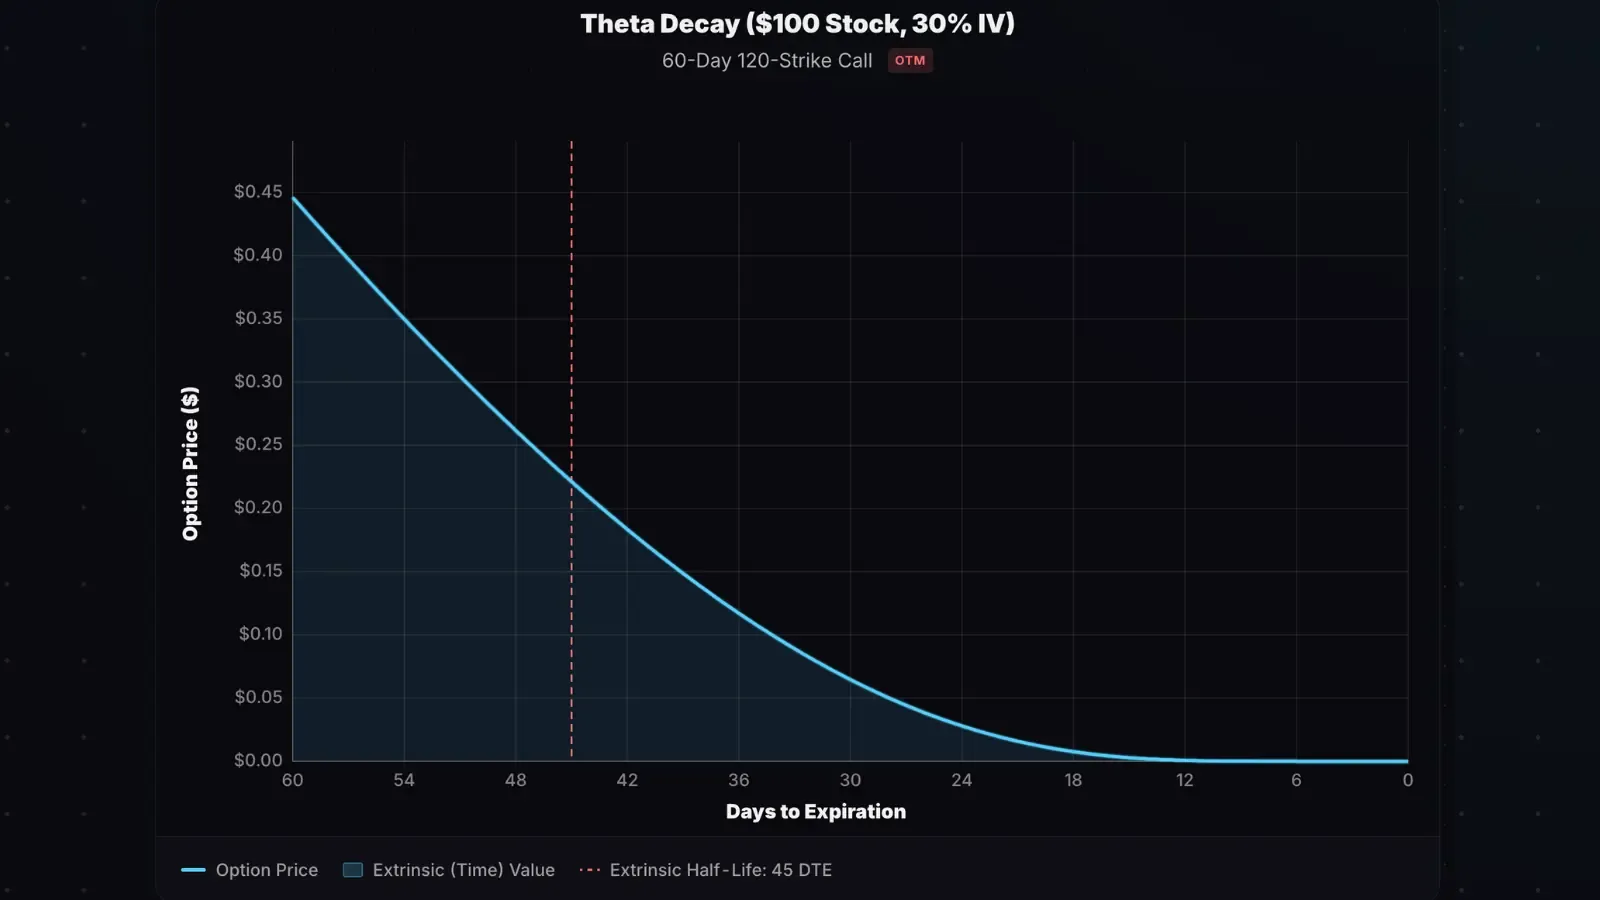
Classic OTM decay—front-loaded, then flat. The 120 strike becomes well outside the expected range at 30% IV as the days pass.
Now ramp IV to 200%:
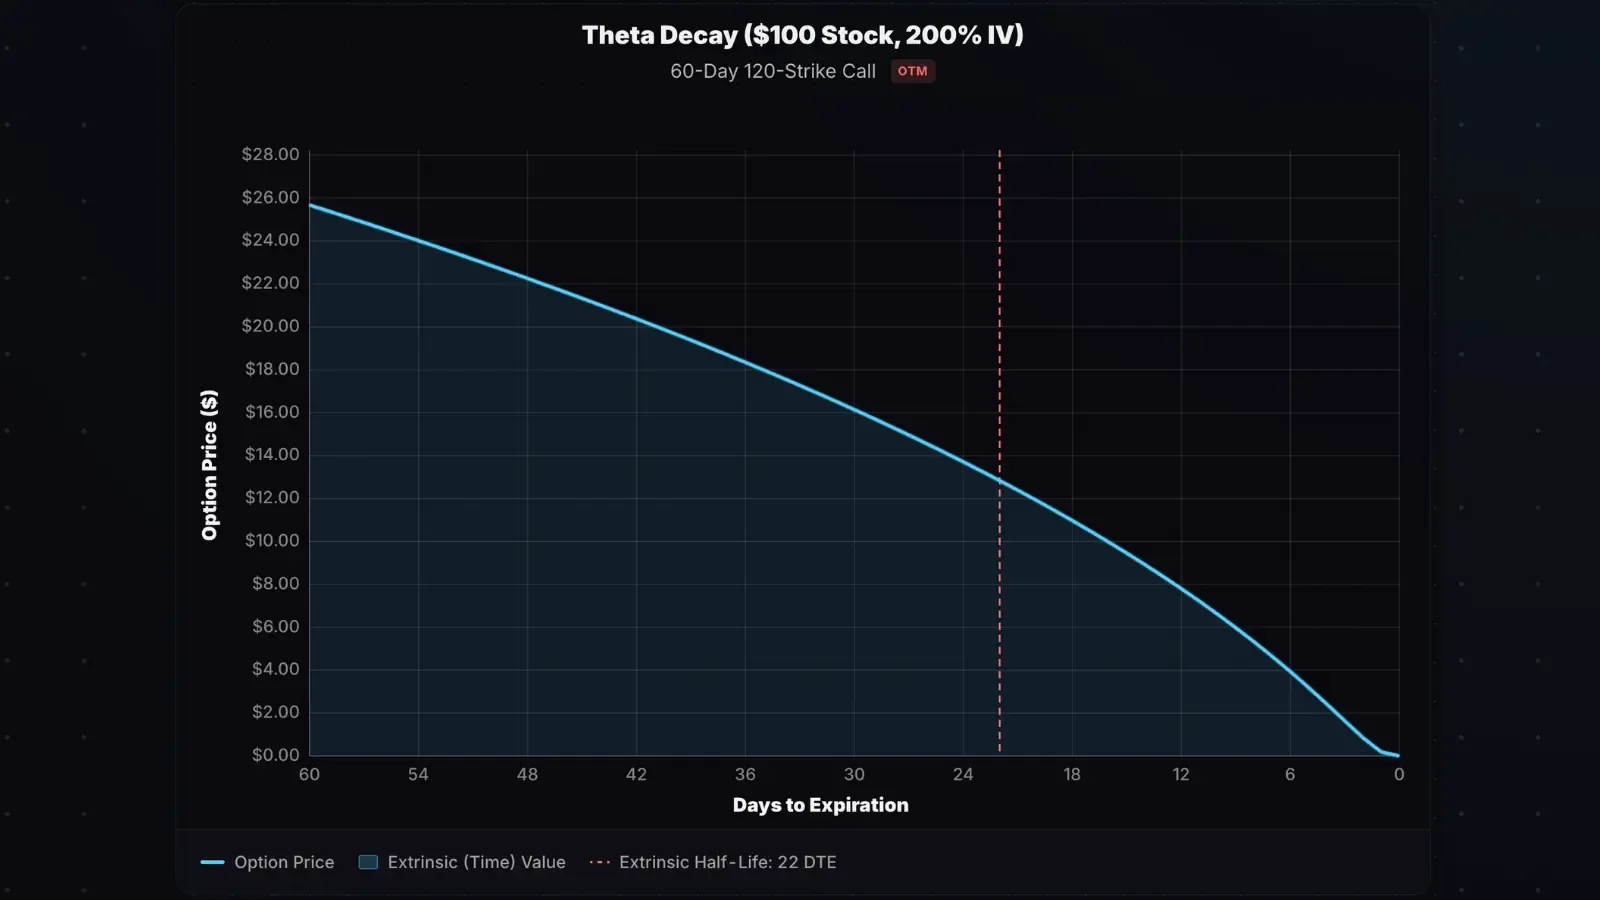
Same strike, completely different profile. At 200% IV, that 120 call is effectively ATM relative to the expected range—and decays like it.
Lower IV narrows the cone, so only ATM strikes have meaningful extrinsic. OTM decay flattens early because there’s almost nothing to lose.
Practical Takeaways
If you’re long ATM options: You’re less exposed to time decay early on—the option holds onto its value while it stays inside the expected move cone. For example, an ATM call with 45 DTE might still have 50% of its value left at 12 DTE. But that changes fast. In the final weeks, decay accelerates sharply. The final 25% could vanish in the last 2-3 days. Consider exiting or rolling before the cliff.
If you’re long OTM options: Decay is front-loaded. If the stock doesn’t move in your favor, most of the option’s value bleeds out well before expiration.
If you’re short ATM options: Decay feels slower at first. You’re waiting for the expected move to shrink. The payoff comes late—rapid favorable decay in the final days before expiration.
If you’re short OTM options: You’ll capture most of your max profit early if the option stays far OTM. Then decay slows as the last 10-20% bleeds out. Closing at 50-75% of max profit is often the sweet spot—the remaining premium isn’t worth the risk of an outlier move erasing your gains.
Theta Decay FAQ
When is theta decay highest?
For ATM options, decay is highest in the final weeks before expiration—accelerating rapidly in the last few days. They stay inside the expected move cone until the end, holding value before collapsing. For OTM options, decay is often highest earlier in the option’s life. By the final weeks, there’s little extrinsic left to lose.
How much do options lose to theta per day?
Theta tells you directly. An option with theta of -0.05 loses $0.05 per day, or $5 per contract, all else equal. Hover along the curve in the theta decay calculator to see how theta evolves over an option’s life.
The Bottom Line
Theta decay isn’t one curve—it’s many. The shape depends on moneyness, time remaining, and IV. The expected move framework ties them together: the cone shrinks as expiration approaches, and where your strike sits relative to that shrinking cone determines everything.
Visualize your option’s decay curve: Theta Decay Curve Calculator
Related Resources
- What Is Theta in Options Trading? — Comprehensive theta guide
- Options Greeks Overview — All four primary Greeks
- Options Pricing Calculator — Calculate theta and other Greeks